Carpatho Rusyn vs Indonesian 10th Grade
COMPARE
Carpatho Rusyn
Indonesian
10th Grade
10th Grade Comparison
Carpatho Rusyns
Indonesians
95.9%
10TH GRADE
100.0/ 100
METRIC RATING
5th/ 347
METRIC RANK
91.8%
10TH GRADE
0.0/ 100
METRIC RATING
293rd/ 347
METRIC RANK
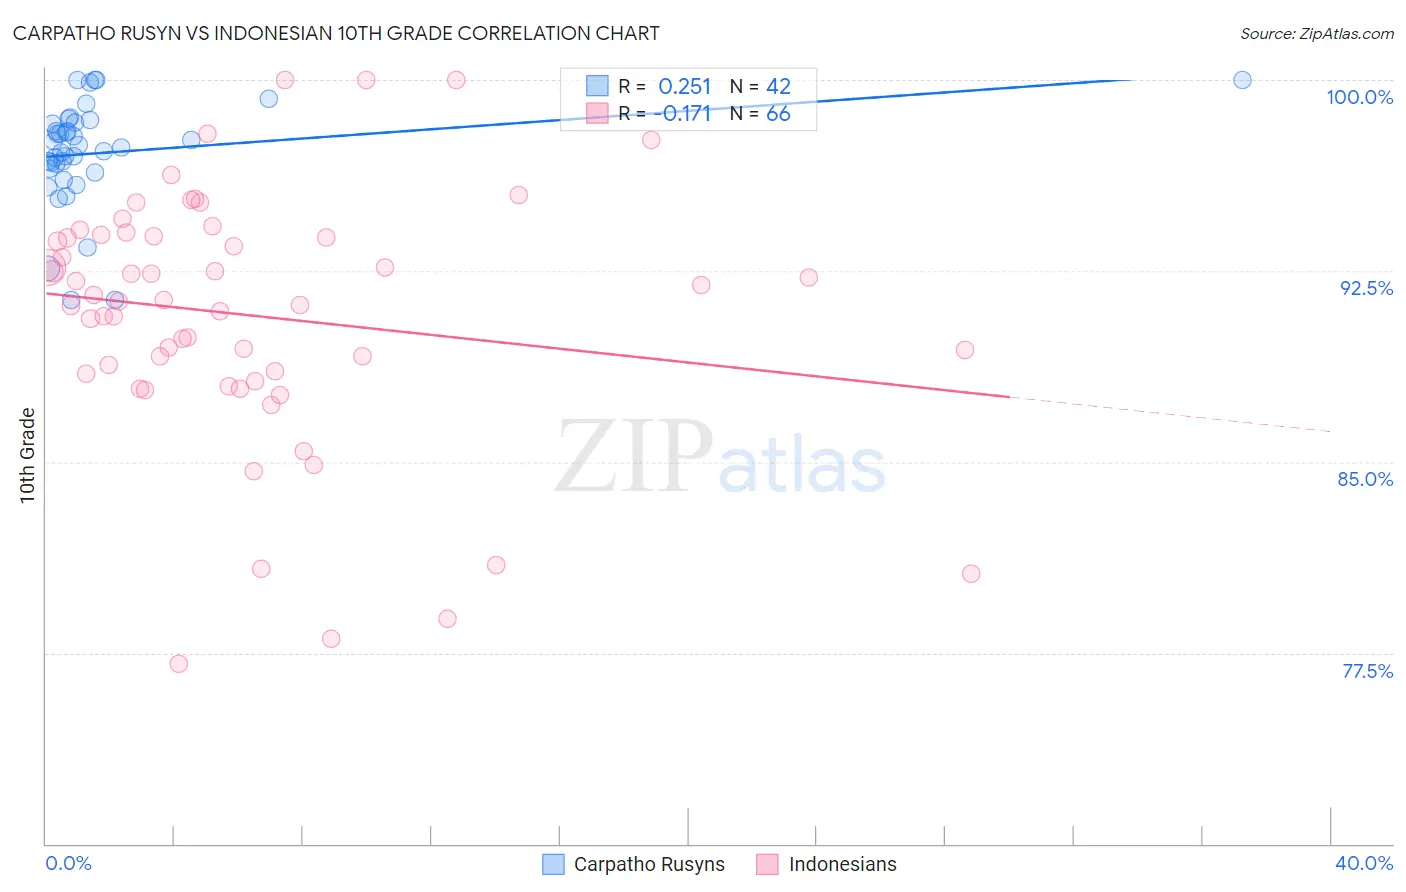
Carpatho Rusyn vs Indonesian 10th Grade Correlation Chart
The statistical analysis conducted on geographies consisting of 58,871,690 people shows a weak positive correlation between the proportion of Carpatho Rusyns and percentage of population with at least 10th grade education in the United States with a correlation coefficient (R) of 0.251 and weighted average of 95.9%. Similarly, the statistical analysis conducted on geographies consisting of 162,727,113 people shows a poor negative correlation between the proportion of Indonesians and percentage of population with at least 10th grade education in the United States with a correlation coefficient (R) of -0.171 and weighted average of 91.8%, a difference of 4.5%.
10th Grade Correlation Summary
| Measurement | Carpatho Rusyn | Indonesian |
| Minimum | 91.4% | 77.1% |
| Maximum | 100.0% | 100.0% |
| Range | 8.6% | 22.9% |
| Mean | 97.2% | 90.7% |
| Median | 97.4% | 91.3% |
| Interquartile 25% (IQ1) | 96.5% | 88.5% |
| Interquartile 75% (IQ3) | 98.3% | 93.9% |
| Interquartile Range (IQR) | 1.8% | 5.4% |
| Standard Deviation (Sample) | 2.1% | 5.0% |
| Standard Deviation (Population) | 2.0% | 4.9% |
Similar Demographics by 10th Grade
Demographics Similar to Carpatho Rusyns by 10th Grade
In terms of 10th grade, the demographic groups most similar to Carpatho Rusyns are Slovene (95.9%, a difference of 0.020%), Swedish (95.9%, a difference of 0.020%), Polish (95.8%, a difference of 0.10%), German (95.8%, a difference of 0.11%), and Slovak (96.0%, a difference of 0.12%).
| Demographics | Rating | Rank | 10th Grade |
| Norwegians | 100.0 /100 | #1 | Exceptional 96.2% |
| Slovaks | 100.0 /100 | #2 | Exceptional 96.0% |
| Slovenes | 100.0 /100 | #3 | Exceptional 95.9% |
| Swedes | 100.0 /100 | #4 | Exceptional 95.9% |
| Carpatho Rusyns | 100.0 /100 | #5 | Exceptional 95.9% |
| Poles | 100.0 /100 | #6 | Exceptional 95.8% |
| Germans | 100.0 /100 | #7 | Exceptional 95.8% |
| Lithuanians | 100.0 /100 | #8 | Exceptional 95.8% |
| Finns | 100.0 /100 | #9 | Exceptional 95.8% |
| Croatians | 100.0 /100 | #10 | Exceptional 95.7% |
| Danes | 100.0 /100 | #11 | Exceptional 95.7% |
| Tlingit-Haida | 100.0 /100 | #12 | Exceptional 95.7% |
| English | 100.0 /100 | #13 | Exceptional 95.6% |
| Tsimshian | 100.0 /100 | #14 | Exceptional 95.6% |
| Irish | 100.0 /100 | #15 | Exceptional 95.6% |
Demographics Similar to Indonesians by 10th Grade
In terms of 10th grade, the demographic groups most similar to Indonesians are Immigrants from West Indies (91.8%, a difference of 0.020%), Immigrants from Burma/Myanmar (91.8%, a difference of 0.020%), British West Indian (91.8%, a difference of 0.030%), Haitian (91.8%, a difference of 0.030%), and Sri Lankan (91.8%, a difference of 0.050%).
| Demographics | Rating | Rank | 10th Grade |
| Yuman | 0.0 /100 | #286 | Tragic 92.0% |
| Pennsylvania Germans | 0.0 /100 | #287 | Tragic 91.9% |
| Immigrants | Laos | 0.0 /100 | #288 | Tragic 91.9% |
| Sri Lankans | 0.0 /100 | #289 | Tragic 91.8% |
| British West Indians | 0.0 /100 | #290 | Tragic 91.8% |
| Immigrants | West Indies | 0.0 /100 | #291 | Tragic 91.8% |
| Immigrants | Burma/Myanmar | 0.0 /100 | #292 | Tragic 91.8% |
| Indonesians | 0.0 /100 | #293 | Tragic 91.8% |
| Haitians | 0.0 /100 | #294 | Tragic 91.8% |
| Lumbee | 0.0 /100 | #295 | Tragic 91.7% |
| Immigrants | Grenada | 0.0 /100 | #296 | Tragic 91.6% |
| Fijians | 0.0 /100 | #297 | Tragic 91.5% |
| Cubans | 0.0 /100 | #298 | Tragic 91.5% |
| Immigrants | Haiti | 0.0 /100 | #299 | Tragic 91.4% |
| Guyanese | 0.0 /100 | #300 | Tragic 91.4% |