Cape Verdean vs Sudanese GED/Equivalency
COMPARE
Cape Verdean
Sudanese
GED/Equivalency
GED/Equivalency Comparison
Cape Verdeans
Sudanese
80.9%
GED/EQUIVALENCY
0.0/ 100
METRIC RATING
313th/ 347
METRIC RANK
85.5%
GED/EQUIVALENCY
35.2/ 100
METRIC RATING
182nd/ 347
METRIC RANK
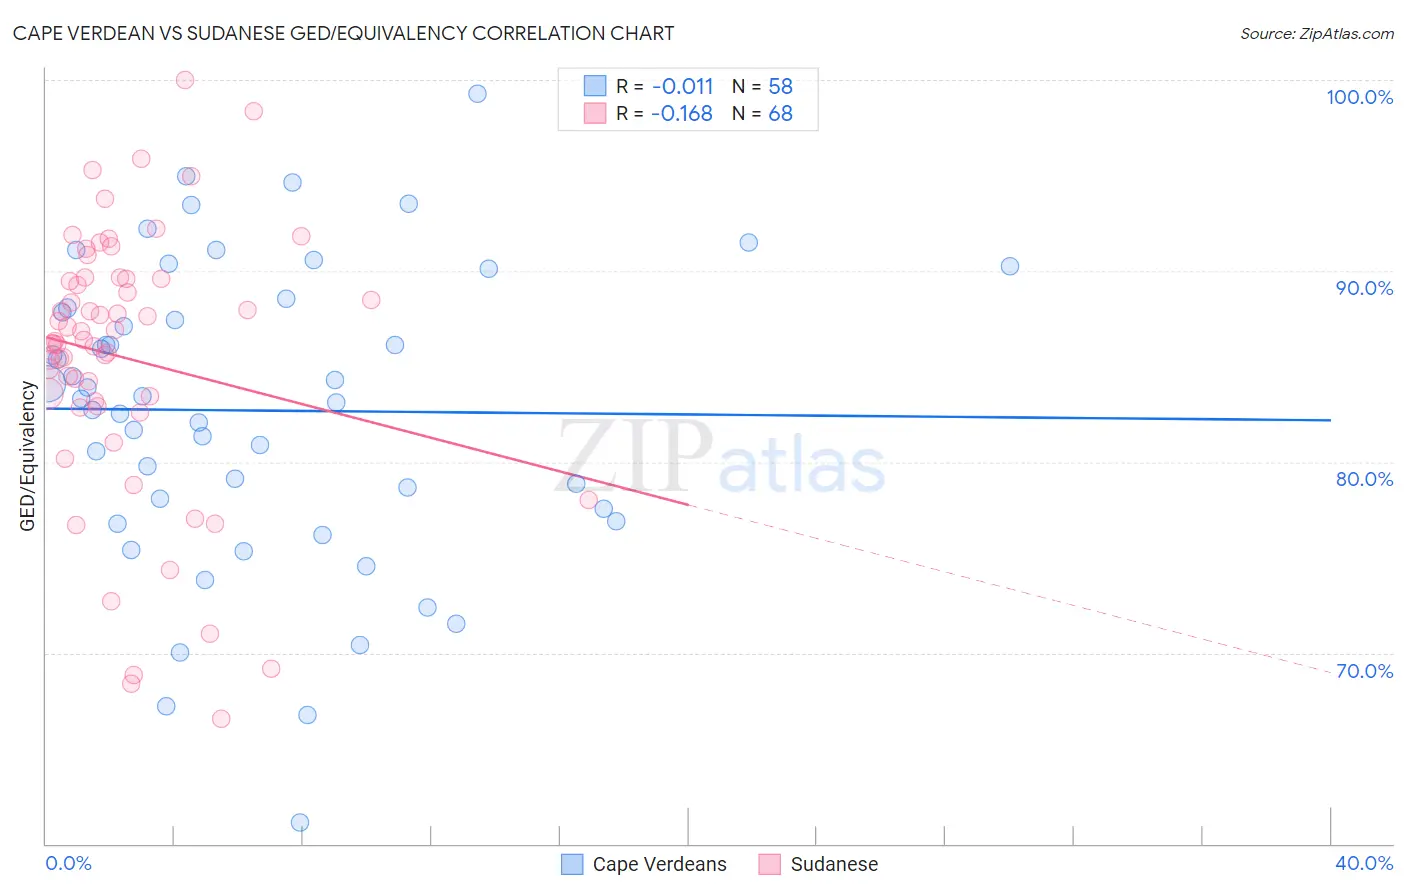
Cape Verdean vs Sudanese GED/Equivalency Correlation Chart
The statistical analysis conducted on geographies consisting of 107,537,955 people shows no correlation between the proportion of Cape Verdeans and percentage of population with at least ged/equivalency education in the United States with a correlation coefficient (R) of -0.011 and weighted average of 80.9%. Similarly, the statistical analysis conducted on geographies consisting of 110,147,806 people shows a poor negative correlation between the proportion of Sudanese and percentage of population with at least ged/equivalency education in the United States with a correlation coefficient (R) of -0.168 and weighted average of 85.5%, a difference of 5.7%.
GED/Equivalency Correlation Summary
| Measurement | Cape Verdean | Sudanese |
| Minimum | 61.1% | 66.5% |
| Maximum | 99.3% | 100.0% |
| Range | 38.1% | 33.5% |
| Mean | 82.7% | 85.4% |
| Median | 83.4% | 86.4% |
| Interquartile 25% (IQ1) | 77.6% | 83.0% |
| Interquartile 75% (IQ3) | 88.1% | 89.6% |
| Interquartile Range (IQR) | 10.5% | 6.5% |
| Standard Deviation (Sample) | 7.9% | 7.0% |
| Standard Deviation (Population) | 7.8% | 7.0% |
Similar Demographics by GED/Equivalency
Demographics Similar to Cape Verdeans by GED/Equivalency
In terms of ged/equivalency, the demographic groups most similar to Cape Verdeans are Nicaraguan (80.9%, a difference of 0.0%), Belizean (80.9%, a difference of 0.020%), Immigrants from Guyana (81.0%, a difference of 0.040%), Native/Alaskan (80.9%, a difference of 0.040%), and Immigrants from Ecuador (81.0%, a difference of 0.10%).
| Demographics | Rating | Rank | GED/Equivalency |
| Guyanese | 0.0 /100 | #306 | Tragic 81.3% |
| Immigrants | Dominica | 0.0 /100 | #307 | Tragic 81.1% |
| Puerto Ricans | 0.0 /100 | #308 | Tragic 81.1% |
| Immigrants | Ecuador | 0.0 /100 | #309 | Tragic 81.0% |
| Immigrants | Guyana | 0.0 /100 | #310 | Tragic 81.0% |
| Natives/Alaskans | 0.0 /100 | #311 | Tragic 80.9% |
| Nicaraguans | 0.0 /100 | #312 | Tragic 80.9% |
| Cape Verdeans | 0.0 /100 | #313 | Tragic 80.9% |
| Belizeans | 0.0 /100 | #314 | Tragic 80.9% |
| Apache | 0.0 /100 | #315 | Tragic 80.7% |
| Central American Indians | 0.0 /100 | #316 | Tragic 80.6% |
| Immigrants | Caribbean | 0.0 /100 | #317 | Tragic 80.5% |
| Yaqui | 0.0 /100 | #318 | Tragic 80.5% |
| Immigrants | Belize | 0.0 /100 | #319 | Tragic 80.5% |
| Immigrants | Cuba | 0.0 /100 | #320 | Tragic 80.2% |
Demographics Similar to Sudanese by GED/Equivalency
In terms of ged/equivalency, the demographic groups most similar to Sudanese are Immigrants from Sudan (85.5%, a difference of 0.020%), Immigrants from Oceania (85.5%, a difference of 0.040%), Spanish (85.4%, a difference of 0.050%), Moroccan (85.5%, a difference of 0.060%), and Immigrants from Southern Europe (85.5%, a difference of 0.070%).
| Demographics | Rating | Rank | GED/Equivalency |
| Immigrants | Bolivia | 49.8 /100 | #175 | Average 85.8% |
| Immigrants | Eastern Africa | 47.7 /100 | #176 | Average 85.7% |
| Immigrants | Uganda | 45.2 /100 | #177 | Average 85.7% |
| Koreans | 41.2 /100 | #178 | Average 85.6% |
| Aleuts | 40.5 /100 | #179 | Average 85.6% |
| Immigrants | Southern Europe | 38.4 /100 | #180 | Fair 85.5% |
| Moroccans | 37.7 /100 | #181 | Fair 85.5% |
| Sudanese | 35.2 /100 | #182 | Fair 85.5% |
| Immigrants | Sudan | 34.2 /100 | #183 | Fair 85.5% |
| Immigrants | Oceania | 33.6 /100 | #184 | Fair 85.5% |
| Spanish | 32.8 /100 | #185 | Fair 85.4% |
| Spaniards | 31.9 /100 | #186 | Fair 85.4% |
| Immigrants | Afghanistan | 29.8 /100 | #187 | Fair 85.4% |
| Immigrants | Sierra Leone | 29.0 /100 | #188 | Fair 85.4% |
| Guamanians/Chamorros | 28.4 /100 | #189 | Fair 85.3% |