Cape Verdean vs Sudanese In Labor Force | Age > 16
COMPARE
Cape Verdean
Sudanese
In Labor Force | Age > 16
In Labor Force | Age > 16 Comparison
Cape Verdeans
Sudanese
66.6%
IN LABOR FORCE | AGE > 16
100.0/ 100
METRIC RATING
50th/ 347
METRIC RANK
68.0%
IN LABOR FORCE | AGE > 16
100.0/ 100
METRIC RATING
12th/ 347
METRIC RANK
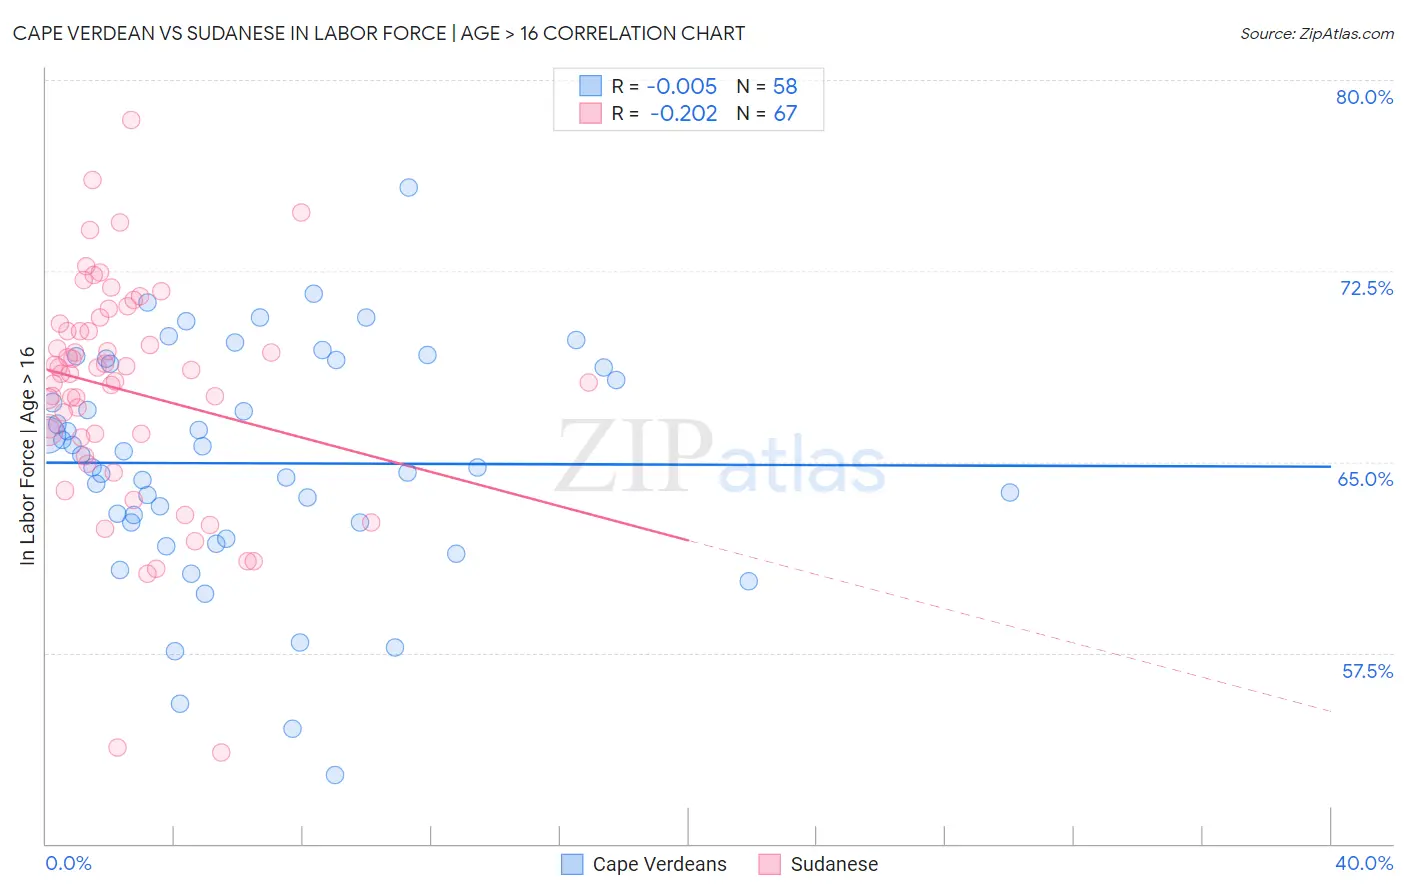
Cape Verdean vs Sudanese In Labor Force | Age > 16 Correlation Chart
The statistical analysis conducted on geographies consisting of 107,578,429 people shows no correlation between the proportion of Cape Verdeans and labor force participation rate among population ages 16 and over in the United States with a correlation coefficient (R) of -0.005 and weighted average of 66.6%. Similarly, the statistical analysis conducted on geographies consisting of 110,150,876 people shows a weak negative correlation between the proportion of Sudanese and labor force participation rate among population ages 16 and over in the United States with a correlation coefficient (R) of -0.202 and weighted average of 68.0%, a difference of 2.2%.
In Labor Force | Age > 16 Correlation Summary
| Measurement | Cape Verdean | Sudanese |
| Minimum | 52.7% | 53.6% |
| Maximum | 75.8% | 78.4% |
| Range | 23.1% | 24.8% |
| Mean | 64.9% | 67.8% |
| Median | 65.0% | 68.5% |
| Interquartile 25% (IQ1) | 62.6% | 65.9% |
| Interquartile 75% (IQ3) | 68.9% | 70.4% |
| Interquartile Range (IQR) | 6.3% | 4.5% |
| Standard Deviation (Sample) | 4.6% | 4.5% |
| Standard Deviation (Population) | 4.5% | 4.5% |
Similar Demographics by In Labor Force | Age > 16
Demographics Similar to Cape Verdeans by In Labor Force | Age > 16
In terms of in labor force | age > 16, the demographic groups most similar to Cape Verdeans are Immigrants from Northern Africa (66.6%, a difference of 0.050%), Nigerian (66.6%, a difference of 0.070%), Immigrants from Kuwait (66.5%, a difference of 0.070%), Brazilian (66.6%, a difference of 0.080%), and Immigrants from Bulgaria (66.6%, a difference of 0.080%).
| Demographics | Rating | Rank | In Labor Force | Age > 16 |
| Luxembourgers | 100.0 /100 | #43 | Exceptional 66.7% |
| Immigrants | Pakistan | 100.0 /100 | #44 | Exceptional 66.7% |
| Immigrants | Brazil | 100.0 /100 | #45 | Exceptional 66.7% |
| Brazilians | 100.0 /100 | #46 | Exceptional 66.6% |
| Immigrants | Bulgaria | 100.0 /100 | #47 | Exceptional 66.6% |
| Nigerians | 100.0 /100 | #48 | Exceptional 66.6% |
| Immigrants | Northern Africa | 100.0 /100 | #49 | Exceptional 66.6% |
| Cape Verdeans | 100.0 /100 | #50 | Exceptional 66.6% |
| Immigrants | Kuwait | 100.0 /100 | #51 | Exceptional 66.5% |
| Paraguayans | 99.9 /100 | #52 | Exceptional 66.5% |
| Immigrants | Sri Lanka | 99.9 /100 | #53 | Exceptional 66.5% |
| Immigrants | Bosnia and Herzegovina | 99.9 /100 | #54 | Exceptional 66.5% |
| Immigrants | Venezuela | 99.9 /100 | #55 | Exceptional 66.4% |
| Immigrants | Senegal | 99.9 /100 | #56 | Exceptional 66.4% |
| Bulgarians | 99.9 /100 | #57 | Exceptional 66.4% |
Demographics Similar to Sudanese by In Labor Force | Age > 16
In terms of in labor force | age > 16, the demographic groups most similar to Sudanese are Immigrants from Nepal (68.0%, a difference of 0.020%), Bolivian (68.2%, a difference of 0.22%), Liberian (67.8%, a difference of 0.38%), Immigrants from Middle Africa (67.7%, a difference of 0.44%), and Immigrants from Sudan (67.7%, a difference of 0.54%).
| Demographics | Rating | Rank | In Labor Force | Age > 16 |
| Sierra Leoneans | 100.0 /100 | #5 | Exceptional 68.9% |
| Immigrants | Eritrea | 100.0 /100 | #6 | Exceptional 68.9% |
| Immigrants | Cameroon | 100.0 /100 | #7 | Exceptional 68.7% |
| Immigrants | Sierra Leone | 100.0 /100 | #8 | Exceptional 68.5% |
| Immigrants | Eastern Africa | 100.0 /100 | #9 | Exceptional 68.5% |
| Immigrants | Bolivia | 100.0 /100 | #10 | Exceptional 68.4% |
| Bolivians | 100.0 /100 | #11 | Exceptional 68.2% |
| Sudanese | 100.0 /100 | #12 | Exceptional 68.0% |
| Immigrants | Nepal | 100.0 /100 | #13 | Exceptional 68.0% |
| Liberians | 100.0 /100 | #14 | Exceptional 67.8% |
| Immigrants | Middle Africa | 100.0 /100 | #15 | Exceptional 67.7% |
| Immigrants | Sudan | 100.0 /100 | #16 | Exceptional 67.7% |
| Immigrants | India | 100.0 /100 | #17 | Exceptional 67.6% |
| Immigrants | Liberia | 100.0 /100 | #18 | Exceptional 67.6% |
| Kenyans | 100.0 /100 | #19 | Exceptional 67.6% |