Cape Verdean vs Nepalese Divorced or Separated
COMPARE
Cape Verdean
Nepalese
Divorced or Separated
Divorced or Separated Comparison
Cape Verdeans
Nepalese
13.1%
DIVORCED OR SEPARATED
0.0/ 100
METRIC RATING
303rd/ 347
METRIC RANK
12.5%
DIVORCED OR SEPARATED
1.8/ 100
METRIC RATING
248th/ 347
METRIC RANK
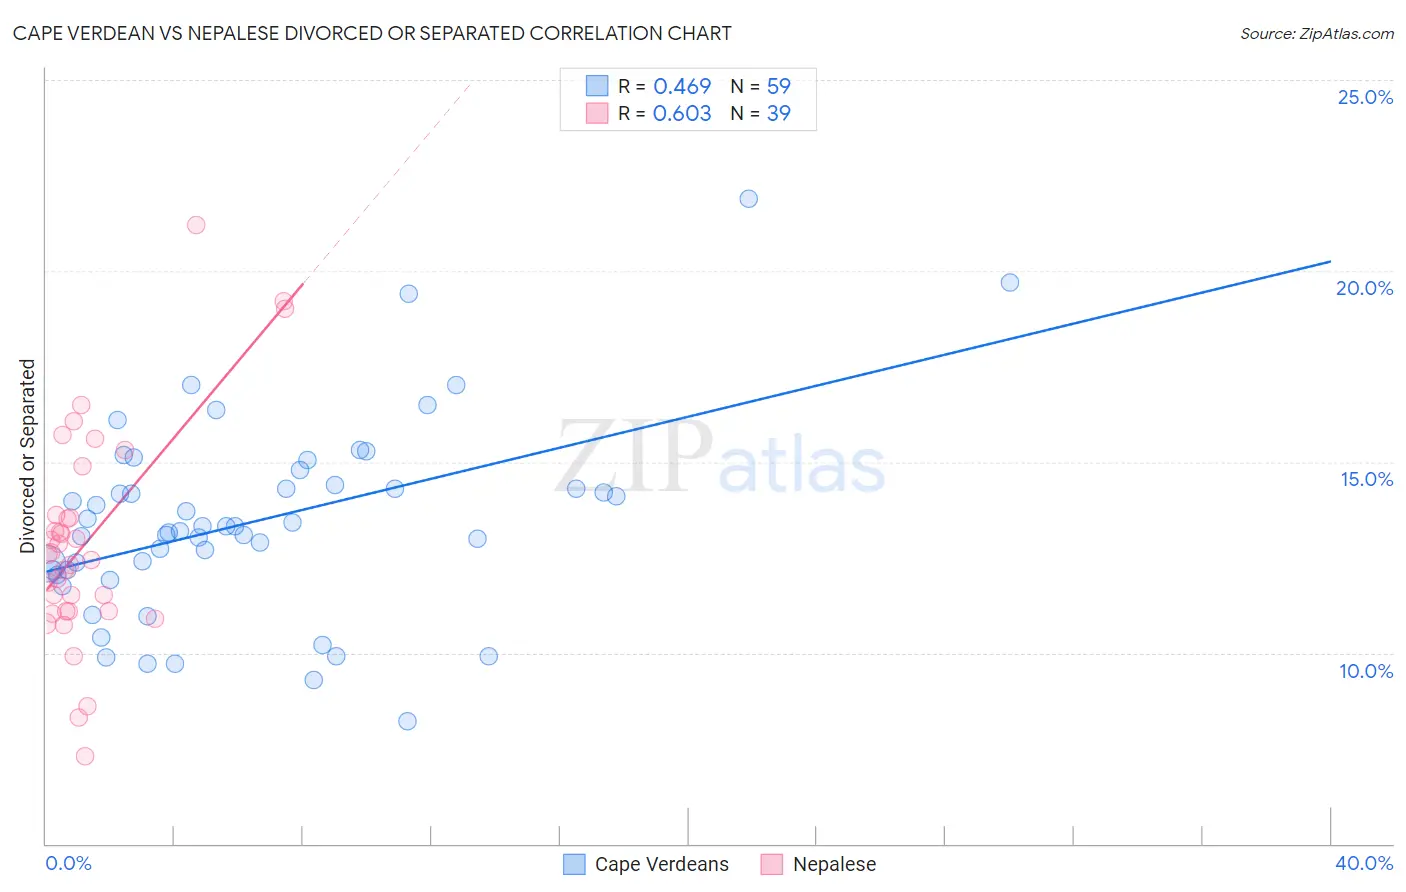
Cape Verdean vs Nepalese Divorced or Separated Correlation Chart
The statistical analysis conducted on geographies consisting of 107,557,736 people shows a moderate positive correlation between the proportion of Cape Verdeans and percentage of population currently divorced or separated in the United States with a correlation coefficient (R) of 0.469 and weighted average of 13.1%. Similarly, the statistical analysis conducted on geographies consisting of 24,519,269 people shows a significant positive correlation between the proportion of Nepalese and percentage of population currently divorced or separated in the United States with a correlation coefficient (R) of 0.603 and weighted average of 12.5%, a difference of 5.3%.
Divorced or Separated Correlation Summary
| Measurement | Cape Verdean | Nepalese |
| Minimum | 8.2% | 7.3% |
| Maximum | 21.9% | 21.2% |
| Range | 13.7% | 13.9% |
| Mean | 13.4% | 12.9% |
| Median | 13.3% | 12.6% |
| Interquartile 25% (IQ1) | 12.2% | 11.1% |
| Interquartile 75% (IQ3) | 14.4% | 13.6% |
| Interquartile Range (IQR) | 2.2% | 2.5% |
| Standard Deviation (Sample) | 2.6% | 2.9% |
| Standard Deviation (Population) | 2.5% | 2.8% |
Similar Demographics by Divorced or Separated
Demographics Similar to Cape Verdeans by Divorced or Separated
In terms of divorced or separated, the demographic groups most similar to Cape Verdeans are Immigrants from Venezuela (13.1%, a difference of 0.020%), Alaskan Athabascan (13.1%, a difference of 0.12%), Hopi (13.2%, a difference of 0.13%), Chippewa (13.2%, a difference of 0.18%), and Immigrants from Cabo Verde (13.1%, a difference of 0.33%).
| Demographics | Rating | Rank | Divorced or Separated |
| Nicaraguans | 0.0 /100 | #296 | Tragic 13.0% |
| Natives/Alaskans | 0.0 /100 | #297 | Tragic 13.0% |
| Venezuelans | 0.0 /100 | #298 | Tragic 13.0% |
| Immigrants | Jamaica | 0.0 /100 | #299 | Tragic 13.0% |
| Immigrants | Cabo Verde | 0.0 /100 | #300 | Tragic 13.1% |
| Alaskan Athabascans | 0.0 /100 | #301 | Tragic 13.1% |
| Immigrants | Venezuela | 0.0 /100 | #302 | Tragic 13.1% |
| Cape Verdeans | 0.0 /100 | #303 | Tragic 13.1% |
| Hopi | 0.0 /100 | #304 | Tragic 13.2% |
| Chippewa | 0.0 /100 | #305 | Tragic 13.2% |
| Tlingit-Haida | 0.0 /100 | #306 | Tragic 13.2% |
| French American Indians | 0.0 /100 | #307 | Tragic 13.2% |
| Ottawa | 0.0 /100 | #308 | Tragic 13.2% |
| Americans | 0.0 /100 | #309 | Tragic 13.2% |
| Africans | 0.0 /100 | #310 | Tragic 13.2% |
Demographics Similar to Nepalese by Divorced or Separated
In terms of divorced or separated, the demographic groups most similar to Nepalese are Finnish (12.5%, a difference of 0.010%), German (12.5%, a difference of 0.020%), Immigrants from West Indies (12.5%, a difference of 0.060%), Hispanic or Latino (12.5%, a difference of 0.080%), and Irish (12.5%, a difference of 0.29%).
| Demographics | Rating | Rank | Divorced or Separated |
| Uruguayans | 3.4 /100 | #241 | Tragic 12.4% |
| Dutch | 3.1 /100 | #242 | Tragic 12.4% |
| Immigrants | Latin America | 2.8 /100 | #243 | Tragic 12.4% |
| Alaska Natives | 2.5 /100 | #244 | Tragic 12.4% |
| Hispanics or Latinos | 2.0 /100 | #245 | Tragic 12.5% |
| Immigrants | West Indies | 1.9 /100 | #246 | Tragic 12.5% |
| Germans | 1.8 /100 | #247 | Tragic 12.5% |
| Nepalese | 1.8 /100 | #248 | Tragic 12.5% |
| Finns | 1.8 /100 | #249 | Tragic 12.5% |
| Irish | 1.3 /100 | #250 | Tragic 12.5% |
| Aleuts | 1.3 /100 | #251 | Tragic 12.5% |
| Liberians | 0.9 /100 | #252 | Tragic 12.6% |
| Somalis | 0.9 /100 | #253 | Tragic 12.6% |
| Senegalese | 0.8 /100 | #254 | Tragic 12.6% |
| Welsh | 0.7 /100 | #255 | Tragic 12.6% |