Cape Verdean vs Immigrants from Latvia 4th Grade
COMPARE
Cape Verdean
Immigrants from Latvia
4th Grade
4th Grade Comparison
Cape Verdeans
Immigrants from Latvia
96.2%
4TH GRADE
0.0/ 100
METRIC RATING
312th/ 347
METRIC RANK
97.8%
4TH GRADE
96.8/ 100
METRIC RATING
109th/ 347
METRIC RANK
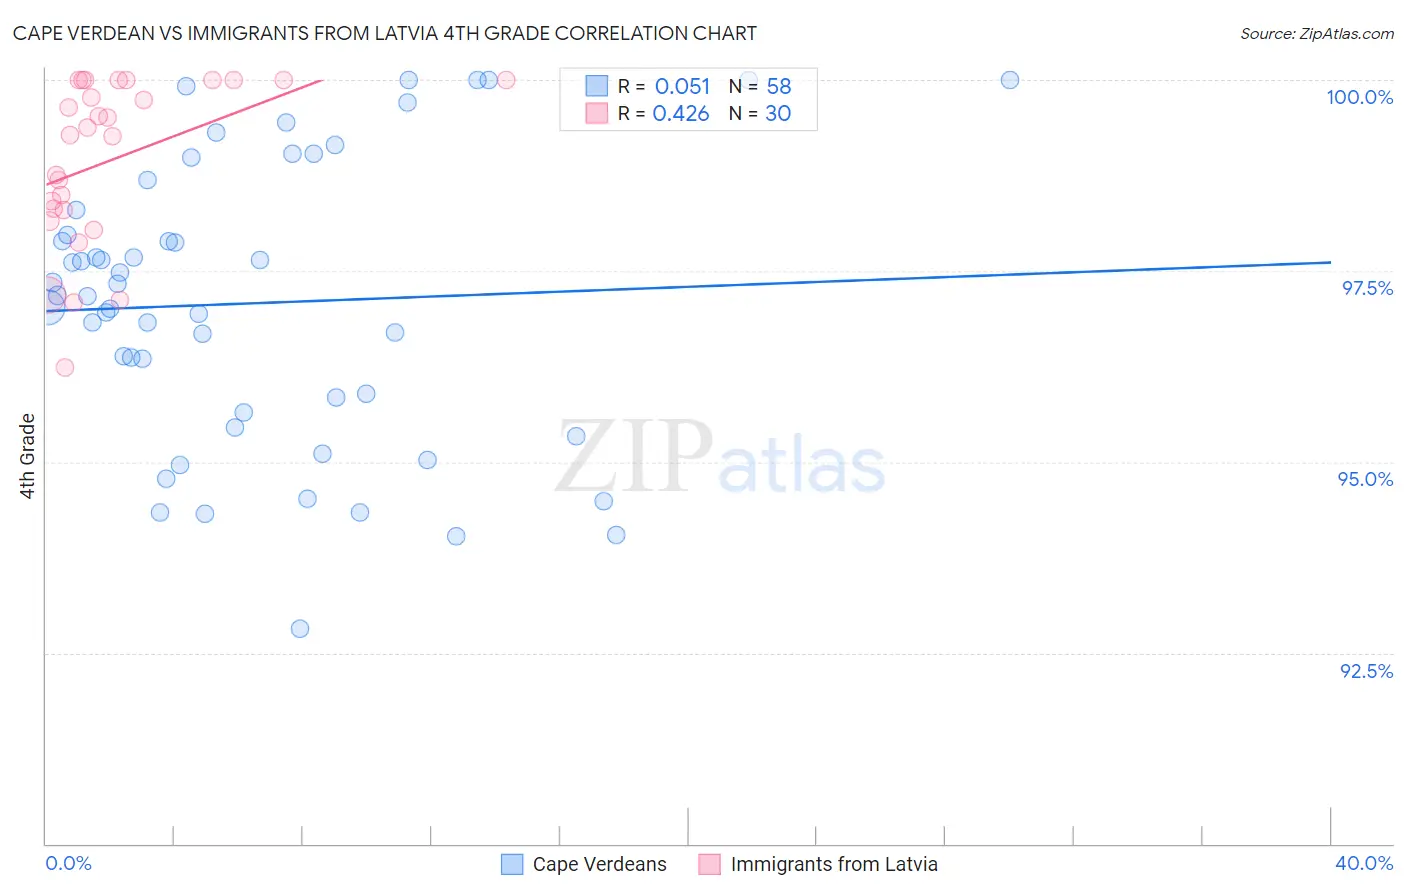
Cape Verdean vs Immigrants from Latvia 4th Grade Correlation Chart
The statistical analysis conducted on geographies consisting of 107,537,955 people shows a slight positive correlation between the proportion of Cape Verdeans and percentage of population with at least 4th grade education in the United States with a correlation coefficient (R) of 0.051 and weighted average of 96.2%. Similarly, the statistical analysis conducted on geographies consisting of 113,724,291 people shows a moderate positive correlation between the proportion of Immigrants from Latvia and percentage of population with at least 4th grade education in the United States with a correlation coefficient (R) of 0.426 and weighted average of 97.8%, a difference of 1.7%.
4th Grade Correlation Summary
| Measurement | Cape Verdean | Immigrants from Latvia |
| Minimum | 92.8% | 96.2% |
| Maximum | 100.0% | 100.0% |
| Range | 7.2% | 3.8% |
| Mean | 97.1% | 99.0% |
| Median | 97.2% | 99.3% |
| Interquartile 25% (IQ1) | 95.7% | 98.3% |
| Interquartile 75% (IQ3) | 98.3% | 100.0% |
| Interquartile Range (IQR) | 2.7% | 1.7% |
| Standard Deviation (Sample) | 1.9% | 1.1% |
| Standard Deviation (Population) | 1.8% | 1.1% |
Similar Demographics by 4th Grade
Demographics Similar to Cape Verdeans by 4th Grade
In terms of 4th grade, the demographic groups most similar to Cape Verdeans are Immigrants from Bangladesh (96.2%, a difference of 0.010%), Indonesian (96.2%, a difference of 0.020%), Vietnamese (96.2%, a difference of 0.020%), Nicaraguan (96.2%, a difference of 0.030%), and Immigrants from Ecuador (96.2%, a difference of 0.030%).
| Demographics | Rating | Rank | 4th Grade |
| Immigrants | Caribbean | 0.0 /100 | #305 | Tragic 96.4% |
| Sri Lankans | 0.0 /100 | #306 | Tragic 96.4% |
| Immigrants | Haiti | 0.0 /100 | #307 | Tragic 96.3% |
| Immigrants | Laos | 0.0 /100 | #308 | Tragic 96.3% |
| Immigrants | Guyana | 0.0 /100 | #309 | Tragic 96.3% |
| Immigrants | Burma/Myanmar | 0.0 /100 | #310 | Tragic 96.3% |
| Immigrants | Bangladesh | 0.0 /100 | #311 | Tragic 96.2% |
| Cape Verdeans | 0.0 /100 | #312 | Tragic 96.2% |
| Indonesians | 0.0 /100 | #313 | Tragic 96.2% |
| Vietnamese | 0.0 /100 | #314 | Tragic 96.2% |
| Nicaraguans | 0.0 /100 | #315 | Tragic 96.2% |
| Immigrants | Ecuador | 0.0 /100 | #316 | Tragic 96.2% |
| Central American Indians | 0.0 /100 | #317 | Tragic 96.2% |
| Immigrants | Azores | 0.0 /100 | #318 | Tragic 96.1% |
| Belizeans | 0.0 /100 | #319 | Tragic 96.1% |
Demographics Similar to Immigrants from Latvia by 4th Grade
In terms of 4th grade, the demographic groups most similar to Immigrants from Latvia are Thai (97.8%, a difference of 0.0%), Immigrants from Czechoslovakia (97.9%, a difference of 0.020%), Bhutanese (97.9%, a difference of 0.020%), Immigrants from Singapore (97.9%, a difference of 0.020%), and Immigrants from Switzerland (97.8%, a difference of 0.020%).
| Demographics | Rating | Rank | 4th Grade |
| Choctaw | 97.9 /100 | #102 | Exceptional 97.9% |
| Puget Sound Salish | 97.7 /100 | #103 | Exceptional 97.9% |
| Immigrants | Nonimmigrants | 97.5 /100 | #104 | Exceptional 97.9% |
| German Russians | 97.5 /100 | #105 | Exceptional 97.9% |
| Immigrants | Czechoslovakia | 97.5 /100 | #106 | Exceptional 97.9% |
| Bhutanese | 97.4 /100 | #107 | Exceptional 97.9% |
| Immigrants | Singapore | 97.3 /100 | #108 | Exceptional 97.9% |
| Immigrants | Latvia | 96.8 /100 | #109 | Exceptional 97.8% |
| Thais | 96.7 /100 | #110 | Exceptional 97.8% |
| Immigrants | Switzerland | 96.1 /100 | #111 | Exceptional 97.8% |
| Okinawans | 96.0 /100 | #112 | Exceptional 97.8% |
| Basques | 95.8 /100 | #113 | Exceptional 97.8% |
| Iroquois | 95.4 /100 | #114 | Exceptional 97.8% |
| Lebanese | 95.4 /100 | #115 | Exceptional 97.8% |
| Immigrants | Croatia | 95.2 /100 | #116 | Exceptional 97.8% |