Cape Verdean vs Celtic 4th Grade
COMPARE
Cape Verdean
Celtic
4th Grade
4th Grade Comparison
Cape Verdeans
Celtics
96.2%
4TH GRADE
0.0/ 100
METRIC RATING
312th/ 347
METRIC RANK
98.1%
4TH GRADE
99.8/ 100
METRIC RATING
51st/ 347
METRIC RANK
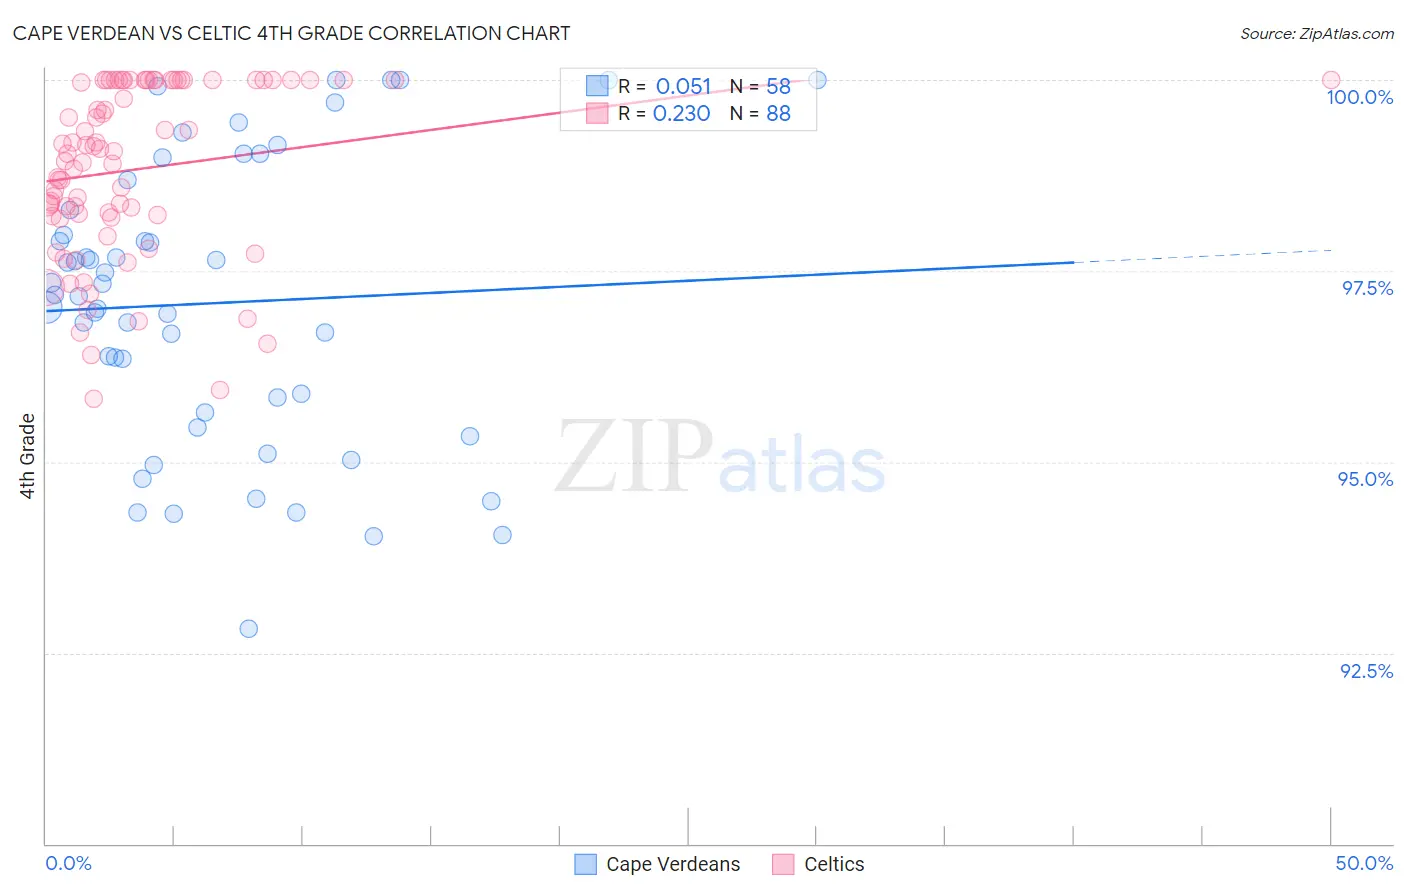
Cape Verdean vs Celtic 4th Grade Correlation Chart
The statistical analysis conducted on geographies consisting of 107,537,955 people shows a slight positive correlation between the proportion of Cape Verdeans and percentage of population with at least 4th grade education in the United States with a correlation coefficient (R) of 0.051 and weighted average of 96.2%. Similarly, the statistical analysis conducted on geographies consisting of 168,875,705 people shows a weak positive correlation between the proportion of Celtics and percentage of population with at least 4th grade education in the United States with a correlation coefficient (R) of 0.230 and weighted average of 98.1%, a difference of 1.9%.
4th Grade Correlation Summary
| Measurement | Cape Verdean | Celtic |
| Minimum | 92.8% | 95.8% |
| Maximum | 100.0% | 100.0% |
| Range | 7.2% | 4.2% |
| Mean | 97.1% | 98.8% |
| Median | 97.2% | 99.1% |
| Interquartile 25% (IQ1) | 95.7% | 98.2% |
| Interquartile 75% (IQ3) | 98.3% | 100.0% |
| Interquartile Range (IQR) | 2.7% | 1.8% |
| Standard Deviation (Sample) | 1.9% | 1.1% |
| Standard Deviation (Population) | 1.8% | 1.1% |
Similar Demographics by 4th Grade
Demographics Similar to Cape Verdeans by 4th Grade
In terms of 4th grade, the demographic groups most similar to Cape Verdeans are Immigrants from Bangladesh (96.2%, a difference of 0.010%), Indonesian (96.2%, a difference of 0.020%), Vietnamese (96.2%, a difference of 0.020%), Nicaraguan (96.2%, a difference of 0.030%), and Immigrants from Ecuador (96.2%, a difference of 0.030%).
| Demographics | Rating | Rank | 4th Grade |
| Immigrants | Caribbean | 0.0 /100 | #305 | Tragic 96.4% |
| Sri Lankans | 0.0 /100 | #306 | Tragic 96.4% |
| Immigrants | Haiti | 0.0 /100 | #307 | Tragic 96.3% |
| Immigrants | Laos | 0.0 /100 | #308 | Tragic 96.3% |
| Immigrants | Guyana | 0.0 /100 | #309 | Tragic 96.3% |
| Immigrants | Burma/Myanmar | 0.0 /100 | #310 | Tragic 96.3% |
| Immigrants | Bangladesh | 0.0 /100 | #311 | Tragic 96.2% |
| Cape Verdeans | 0.0 /100 | #312 | Tragic 96.2% |
| Indonesians | 0.0 /100 | #313 | Tragic 96.2% |
| Vietnamese | 0.0 /100 | #314 | Tragic 96.2% |
| Nicaraguans | 0.0 /100 | #315 | Tragic 96.2% |
| Immigrants | Ecuador | 0.0 /100 | #316 | Tragic 96.2% |
| Central American Indians | 0.0 /100 | #317 | Tragic 96.2% |
| Immigrants | Azores | 0.0 /100 | #318 | Tragic 96.1% |
| Belizeans | 0.0 /100 | #319 | Tragic 96.1% |
Demographics Similar to Celtics by 4th Grade
In terms of 4th grade, the demographic groups most similar to Celtics are Immigrants from Scotland (98.1%, a difference of 0.0%), Australian (98.1%, a difference of 0.0%), Estonian (98.1%, a difference of 0.010%), Bulgarian (98.1%, a difference of 0.010%), and Slavic (98.1%, a difference of 0.010%).
| Demographics | Rating | Rank | 4th Grade |
| Native Hawaiians | 99.9 /100 | #44 | Exceptional 98.1% |
| Czechoslovakians | 99.9 /100 | #45 | Exceptional 98.1% |
| Ottawa | 99.9 /100 | #46 | Exceptional 98.1% |
| Arapaho | 99.9 /100 | #47 | Exceptional 98.1% |
| Estonians | 99.8 /100 | #48 | Exceptional 98.1% |
| Bulgarians | 99.8 /100 | #49 | Exceptional 98.1% |
| Immigrants | Scotland | 99.8 /100 | #50 | Exceptional 98.1% |
| Celtics | 99.8 /100 | #51 | Exceptional 98.1% |
| Australians | 99.8 /100 | #52 | Exceptional 98.1% |
| Slavs | 99.8 /100 | #53 | Exceptional 98.1% |
| Maltese | 99.8 /100 | #54 | Exceptional 98.1% |
| Whites/Caucasians | 99.8 /100 | #55 | Exceptional 98.1% |
| Greeks | 99.8 /100 | #56 | Exceptional 98.1% |
| Austrians | 99.8 /100 | #57 | Exceptional 98.1% |
| Creek | 99.8 /100 | #58 | Exceptional 98.1% |