Canadian vs Shoshone 6th Grade
COMPARE
Canadian
Shoshone
6th Grade
6th Grade Comparison
Canadians
Shoshone
97.7%
6TH GRADE
99.7/ 100
METRIC RATING
64th/ 347
METRIC RANK
97.6%
6TH GRADE
99.0/ 100
METRIC RATING
84th/ 347
METRIC RANK
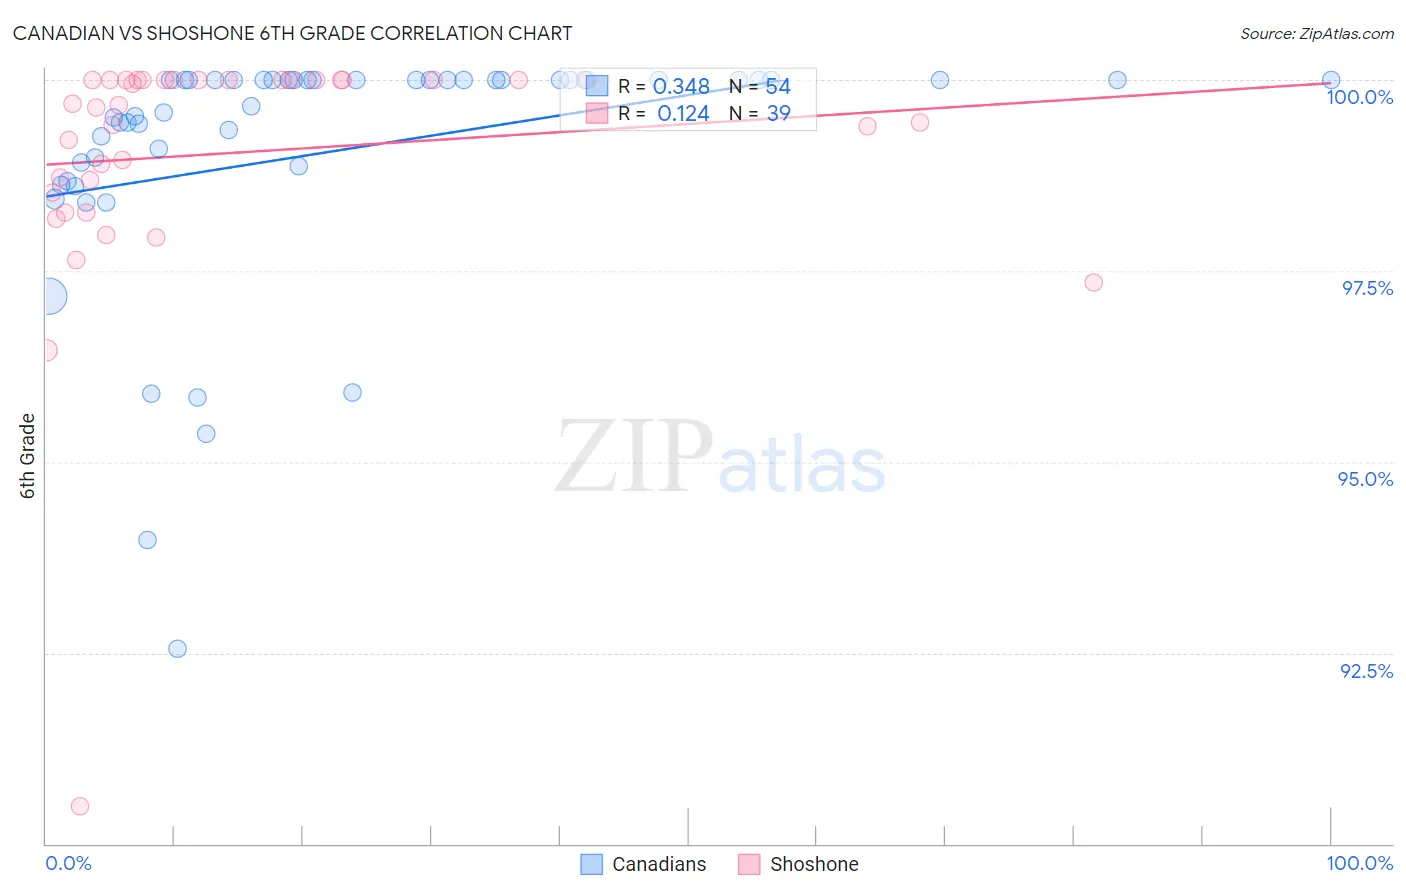
Canadian vs Shoshone 6th Grade Correlation Chart
The statistical analysis conducted on geographies consisting of 437,556,929 people shows a mild positive correlation between the proportion of Canadians and percentage of population with at least 6th grade education in the United States with a correlation coefficient (R) of 0.348 and weighted average of 97.7%. Similarly, the statistical analysis conducted on geographies consisting of 66,625,086 people shows a poor positive correlation between the proportion of Shoshone and percentage of population with at least 6th grade education in the United States with a correlation coefficient (R) of 0.124 and weighted average of 97.6%, a difference of 0.12%.
6th Grade Correlation Summary
| Measurement | Canadian | Shoshone |
| Minimum | 92.6% | 90.5% |
| Maximum | 100.0% | 100.0% |
| Range | 7.4% | 9.5% |
| Mean | 99.1% | 99.0% |
| Median | 100.0% | 99.7% |
| Interquartile 25% (IQ1) | 98.9% | 98.5% |
| Interquartile 75% (IQ3) | 100.0% | 100.0% |
| Interquartile Range (IQR) | 1.1% | 1.5% |
| Standard Deviation (Sample) | 1.6% | 1.7% |
| Standard Deviation (Population) | 1.6% | 1.7% |
Demographics Similar to Canadians and Shoshone by 6th Grade
In terms of 6th grade, the demographic groups most similar to Canadians are Immigrants from Northern Europe (97.7%, a difference of 0.010%), New Zealander (97.7%, a difference of 0.010%), Kiowa (97.7%, a difference of 0.020%), Immigrants from Austria (97.7%, a difference of 0.020%), and Iranian (97.6%, a difference of 0.030%). Similarly, the demographic groups most similar to Shoshone are Zimbabwean (97.6%, a difference of 0.010%), Potawatomi (97.6%, a difference of 0.010%), Lumbee (97.6%, a difference of 0.020%), Immigrants from India (97.6%, a difference of 0.030%), and Osage (97.6%, a difference of 0.030%).
| Demographics | Rating | Rank | 6th Grade |
| Canadians | 99.7 /100 | #64 | Exceptional 97.7% |
| Immigrants | Northern Europe | 99.6 /100 | #65 | Exceptional 97.7% |
| New Zealanders | 99.6 /100 | #66 | Exceptional 97.7% |
| Kiowa | 99.6 /100 | #67 | Exceptional 97.7% |
| Immigrants | Austria | 99.6 /100 | #68 | Exceptional 97.7% |
| Iranians | 99.6 /100 | #69 | Exceptional 97.6% |
| Cajuns | 99.5 /100 | #70 | Exceptional 97.6% |
| Chickasaw | 99.5 /100 | #71 | Exceptional 97.6% |
| Macedonians | 99.4 /100 | #72 | Exceptional 97.6% |
| Cherokee | 99.4 /100 | #73 | Exceptional 97.6% |
| Immigrants | Netherlands | 99.4 /100 | #74 | Exceptional 97.6% |
| Ukrainians | 99.4 /100 | #75 | Exceptional 97.6% |
| Immigrants | England | 99.4 /100 | #76 | Exceptional 97.6% |
| Immigrants | Lithuania | 99.3 /100 | #77 | Exceptional 97.6% |
| Icelanders | 99.3 /100 | #78 | Exceptional 97.6% |
| Immigrants | India | 99.3 /100 | #79 | Exceptional 97.6% |
| Osage | 99.3 /100 | #80 | Exceptional 97.6% |
| Lumbee | 99.2 /100 | #81 | Exceptional 97.6% |
| Zimbabweans | 99.1 /100 | #82 | Exceptional 97.6% |
| Potawatomi | 99.1 /100 | #83 | Exceptional 97.6% |
| Shoshone | 99.0 /100 | #84 | Exceptional 97.6% |