Canadian vs Shoshone 9th Grade
COMPARE
Canadian
Shoshone
9th Grade
9th Grade Comparison
Canadians
Shoshone
95.9%
9TH GRADE
99.7/ 100
METRIC RATING
63rd/ 347
METRIC RANK
95.4%
9TH GRADE
95.3/ 100
METRIC RATING
124th/ 347
METRIC RANK
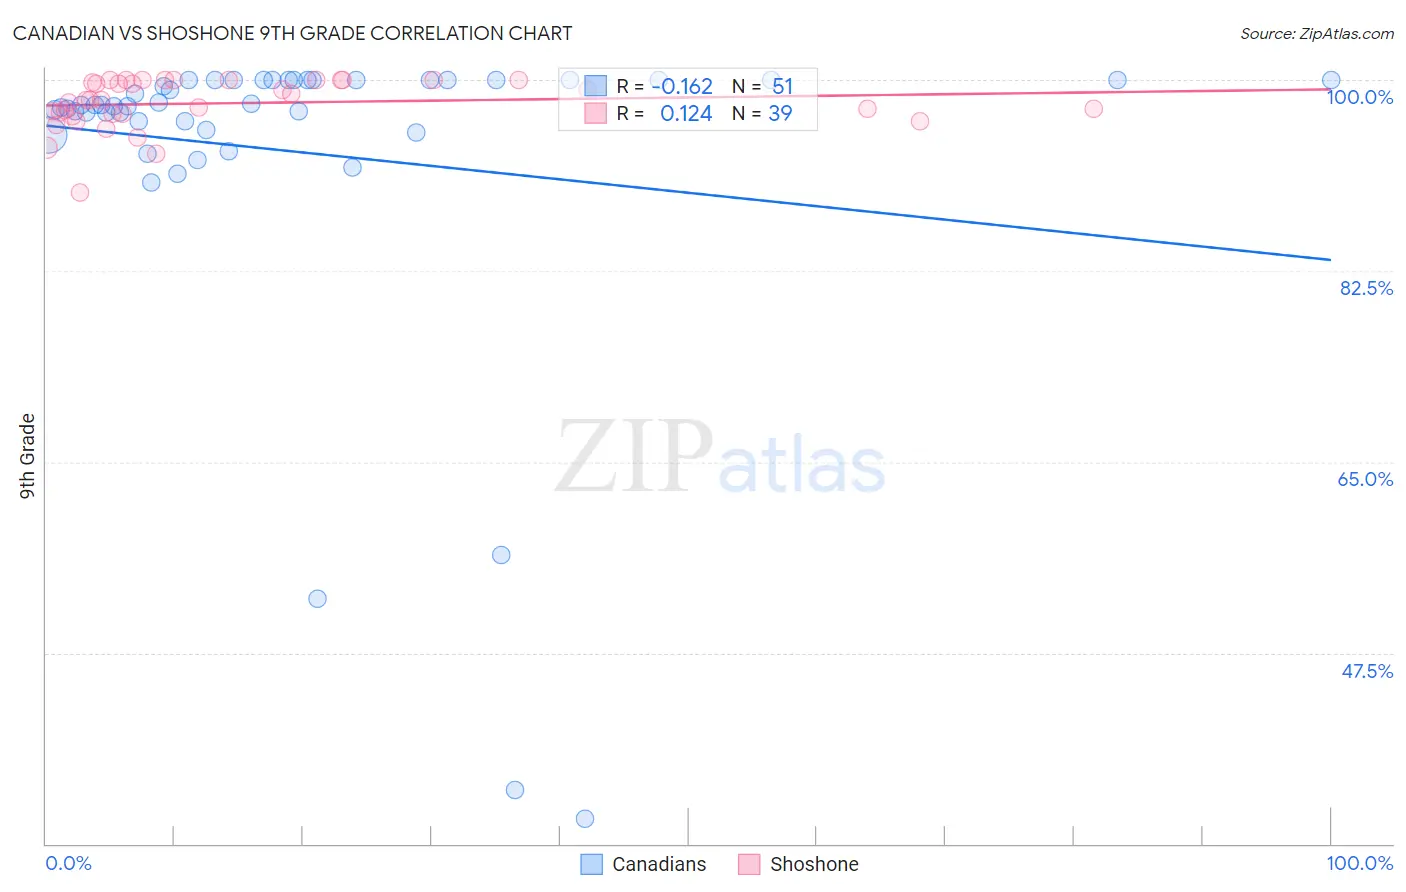
Canadian vs Shoshone 9th Grade Correlation Chart
The statistical analysis conducted on geographies consisting of 437,556,705 people shows a poor negative correlation between the proportion of Canadians and percentage of population with at least 9th grade education in the United States with a correlation coefficient (R) of -0.162 and weighted average of 95.9%. Similarly, the statistical analysis conducted on geographies consisting of 66,625,086 people shows a poor positive correlation between the proportion of Shoshone and percentage of population with at least 9th grade education in the United States with a correlation coefficient (R) of 0.124 and weighted average of 95.4%, a difference of 0.50%.
9th Grade Correlation Summary
| Measurement | Canadian | Shoshone |
| Minimum | 32.3% | 89.7% |
| Maximum | 100.0% | 100.0% |
| Range | 67.7% | 10.3% |
| Mean | 93.4% | 97.9% |
| Median | 97.7% | 98.2% |
| Interquartile 25% (IQ1) | 95.4% | 96.9% |
| Interquartile 75% (IQ3) | 100.0% | 100.0% |
| Interquartile Range (IQR) | 4.6% | 3.1% |
| Standard Deviation (Sample) | 15.1% | 2.3% |
| Standard Deviation (Population) | 14.9% | 2.3% |
Similar Demographics by 9th Grade
Demographics Similar to Canadians by 9th Grade
In terms of 9th grade, the demographic groups most similar to Canadians are Zimbabwean (95.9%, a difference of 0.010%), Immigrants from England (95.9%, a difference of 0.020%), Ukrainian (95.9%, a difference of 0.040%), Immigrants from Netherlands (95.8%, a difference of 0.040%), and Cypriot (95.8%, a difference of 0.040%).
| Demographics | Rating | Rank | 9th Grade |
| Immigrants | North America | 99.8 /100 | #56 | Exceptional 96.0% |
| Macedonians | 99.8 /100 | #57 | Exceptional 96.0% |
| Aleuts | 99.8 /100 | #58 | Exceptional 96.0% |
| New Zealanders | 99.8 /100 | #59 | Exceptional 95.9% |
| Native Hawaiians | 99.8 /100 | #60 | Exceptional 95.9% |
| Sioux | 99.8 /100 | #61 | Exceptional 95.9% |
| Ukrainians | 99.7 /100 | #62 | Exceptional 95.9% |
| Canadians | 99.7 /100 | #63 | Exceptional 95.9% |
| Zimbabweans | 99.7 /100 | #64 | Exceptional 95.9% |
| Immigrants | England | 99.6 /100 | #65 | Exceptional 95.9% |
| Immigrants | Netherlands | 99.6 /100 | #66 | Exceptional 95.8% |
| Cypriots | 99.6 /100 | #67 | Exceptional 95.8% |
| Immigrants | Ireland | 99.6 /100 | #68 | Exceptional 95.8% |
| Immigrants | Lithuania | 99.6 /100 | #69 | Exceptional 95.8% |
| Immigrants | Australia | 99.5 /100 | #70 | Exceptional 95.8% |
Demographics Similar to Shoshone by 9th Grade
In terms of 9th grade, the demographic groups most similar to Shoshone are Kiowa (95.4%, a difference of 0.0%), Cambodian (95.4%, a difference of 0.010%), Cree (95.4%, a difference of 0.010%), Immigrants from Kuwait (95.4%, a difference of 0.010%), and Immigrants from South Central Asia (95.4%, a difference of 0.010%).
| Demographics | Rating | Rank | 9th Grade |
| Immigrants | Romania | 95.6 /100 | #117 | Exceptional 95.4% |
| Immigrants | Turkey | 95.6 /100 | #118 | Exceptional 95.4% |
| Soviet Union | 95.6 /100 | #119 | Exceptional 95.4% |
| Cambodians | 95.6 /100 | #120 | Exceptional 95.4% |
| Cree | 95.5 /100 | #121 | Exceptional 95.4% |
| Immigrants | Kuwait | 95.5 /100 | #122 | Exceptional 95.4% |
| Kiowa | 95.3 /100 | #123 | Exceptional 95.4% |
| Shoshone | 95.3 /100 | #124 | Exceptional 95.4% |
| Immigrants | South Central Asia | 95.1 /100 | #125 | Exceptional 95.4% |
| Immigrants | Serbia | 94.4 /100 | #126 | Exceptional 95.4% |
| Palestinians | 94.3 /100 | #127 | Exceptional 95.4% |
| Immigrants | Hungary | 94.2 /100 | #128 | Exceptional 95.4% |
| Basques | 94.1 /100 | #129 | Exceptional 95.4% |
| Jordanians | 93.5 /100 | #130 | Exceptional 95.3% |
| Immigrants | North Macedonia | 92.3 /100 | #131 | Exceptional 95.3% |