Canadian vs Shoshone Nursery School
COMPARE
Canadian
Shoshone
Nursery School
Nursery School Comparison
Canadians
Shoshone
98.4%
NURSERY SCHOOL
99.7/ 100
METRIC RATING
66th/ 347
METRIC RANK
98.3%
NURSERY SCHOOL
99.3/ 100
METRIC RATING
80th/ 347
METRIC RANK
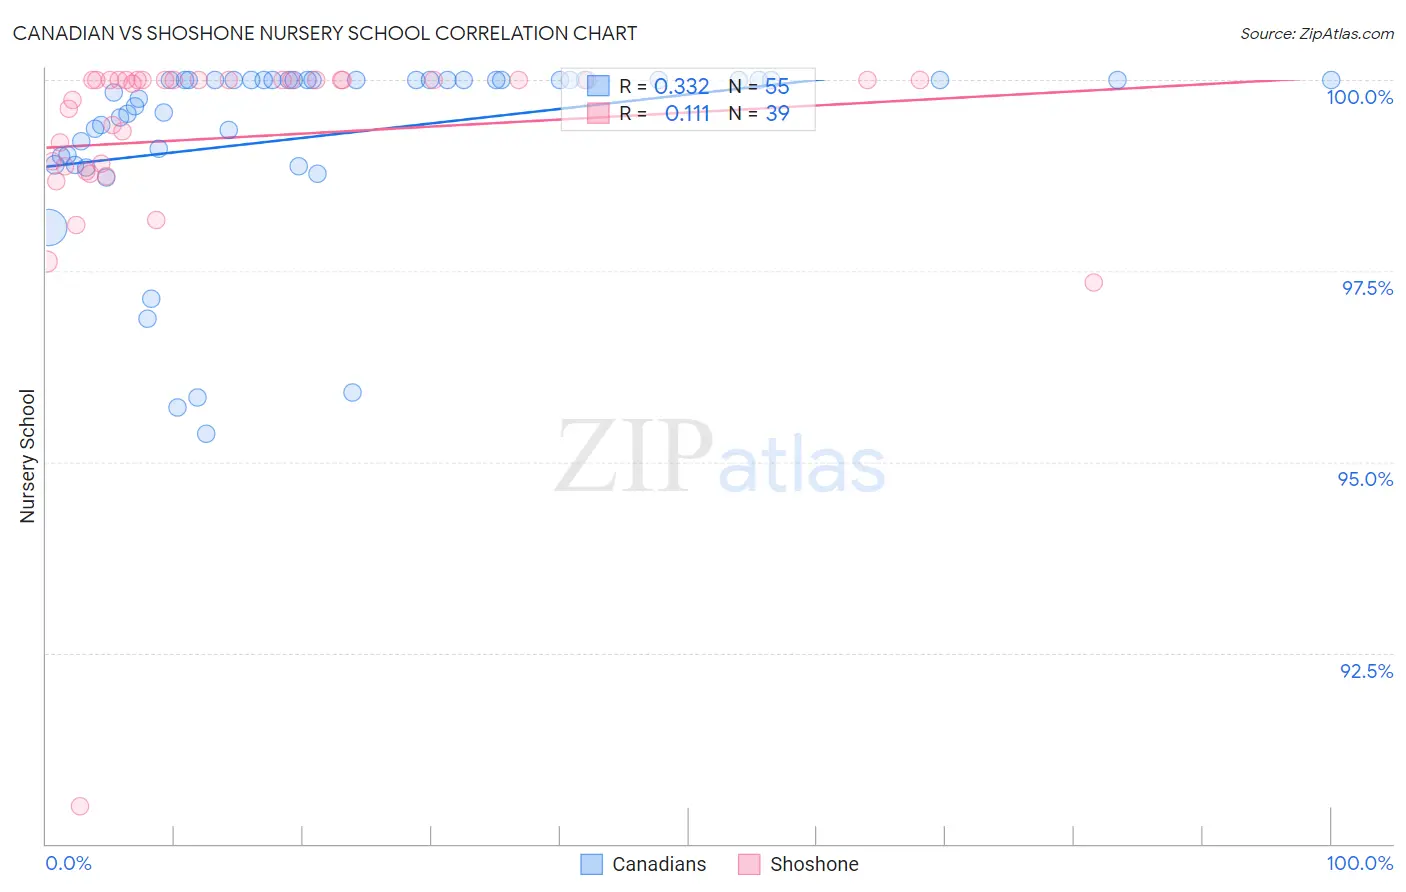
Canadian vs Shoshone Nursery School Correlation Chart
The statistical analysis conducted on geographies consisting of 437,557,033 people shows a mild positive correlation between the proportion of Canadians and percentage of population with at least nursery school education in the United States with a correlation coefficient (R) of 0.332 and weighted average of 98.4%. Similarly, the statistical analysis conducted on geographies consisting of 66,625,086 people shows a poor positive correlation between the proportion of Shoshone and percentage of population with at least nursery school education in the United States with a correlation coefficient (R) of 0.111 and weighted average of 98.3%, a difference of 0.060%.
Nursery School Correlation Summary
| Measurement | Canadian | Shoshone |
| Minimum | 95.4% | 90.5% |
| Maximum | 100.0% | 100.0% |
| Range | 4.6% | 9.5% |
| Mean | 99.3% | 99.2% |
| Median | 100.0% | 100.0% |
| Interquartile 25% (IQ1) | 99.0% | 98.9% |
| Interquartile 75% (IQ3) | 100.0% | 100.0% |
| Interquartile Range (IQR) | 0.99% | 1.1% |
| Standard Deviation (Sample) | 1.2% | 1.6% |
| Standard Deviation (Population) | 1.2% | 1.6% |
Demographics Similar to Canadians and Shoshone by Nursery School
In terms of nursery school, the demographic groups most similar to Canadians are Immigrants from Northern Europe (98.4%, a difference of 0.0%), Russian (98.4%, a difference of 0.010%), Immigrants from Austria (98.4%, a difference of 0.010%), Cheyenne (98.4%, a difference of 0.010%), and Serbian (98.4%, a difference of 0.010%). Similarly, the demographic groups most similar to Shoshone are Delaware (98.3%, a difference of 0.0%), Immigrants from Belgium (98.3%, a difference of 0.0%), Icelander (98.3%, a difference of 0.0%), Immigrants from Netherlands (98.4%, a difference of 0.010%), and Cherokee (98.3%, a difference of 0.010%).
| Demographics | Rating | Rank | Nursery School |
| Immigrants | North America | 99.7 /100 | #63 | Exceptional 98.4% |
| Greeks | 99.7 /100 | #64 | Exceptional 98.4% |
| Maltese | 99.7 /100 | #65 | Exceptional 98.4% |
| Canadians | 99.7 /100 | #66 | Exceptional 98.4% |
| Immigrants | Northern Europe | 99.6 /100 | #67 | Exceptional 98.4% |
| Russians | 99.6 /100 | #68 | Exceptional 98.4% |
| Immigrants | Austria | 99.6 /100 | #69 | Exceptional 98.4% |
| Cheyenne | 99.6 /100 | #70 | Exceptional 98.4% |
| Serbians | 99.6 /100 | #71 | Exceptional 98.4% |
| Chickasaw | 99.6 /100 | #72 | Exceptional 98.4% |
| Cajuns | 99.4 /100 | #73 | Exceptional 98.4% |
| Immigrants | Netherlands | 99.4 /100 | #74 | Exceptional 98.4% |
| Cherokee | 99.3 /100 | #75 | Exceptional 98.3% |
| Immigrants | England | 99.3 /100 | #76 | Exceptional 98.3% |
| Immigrants | Lithuania | 99.3 /100 | #77 | Exceptional 98.3% |
| Delaware | 99.3 /100 | #78 | Exceptional 98.3% |
| Immigrants | Belgium | 99.3 /100 | #79 | Exceptional 98.3% |
| Shoshone | 99.3 /100 | #80 | Exceptional 98.3% |
| Icelanders | 99.2 /100 | #81 | Exceptional 98.3% |
| Potawatomi | 99.2 /100 | #82 | Exceptional 98.3% |
| Osage | 99.1 /100 | #83 | Exceptional 98.3% |