Canadian vs Immigrants from Jordan 6th Grade
COMPARE
Canadian
Immigrants from Jordan
6th Grade
6th Grade Comparison
Canadians
Immigrants from Jordan
97.7%
6TH GRADE
99.7/ 100
METRIC RATING
64th/ 347
METRIC RANK
97.2%
6TH GRADE
73.0/ 100
METRIC RATING
152nd/ 347
METRIC RANK
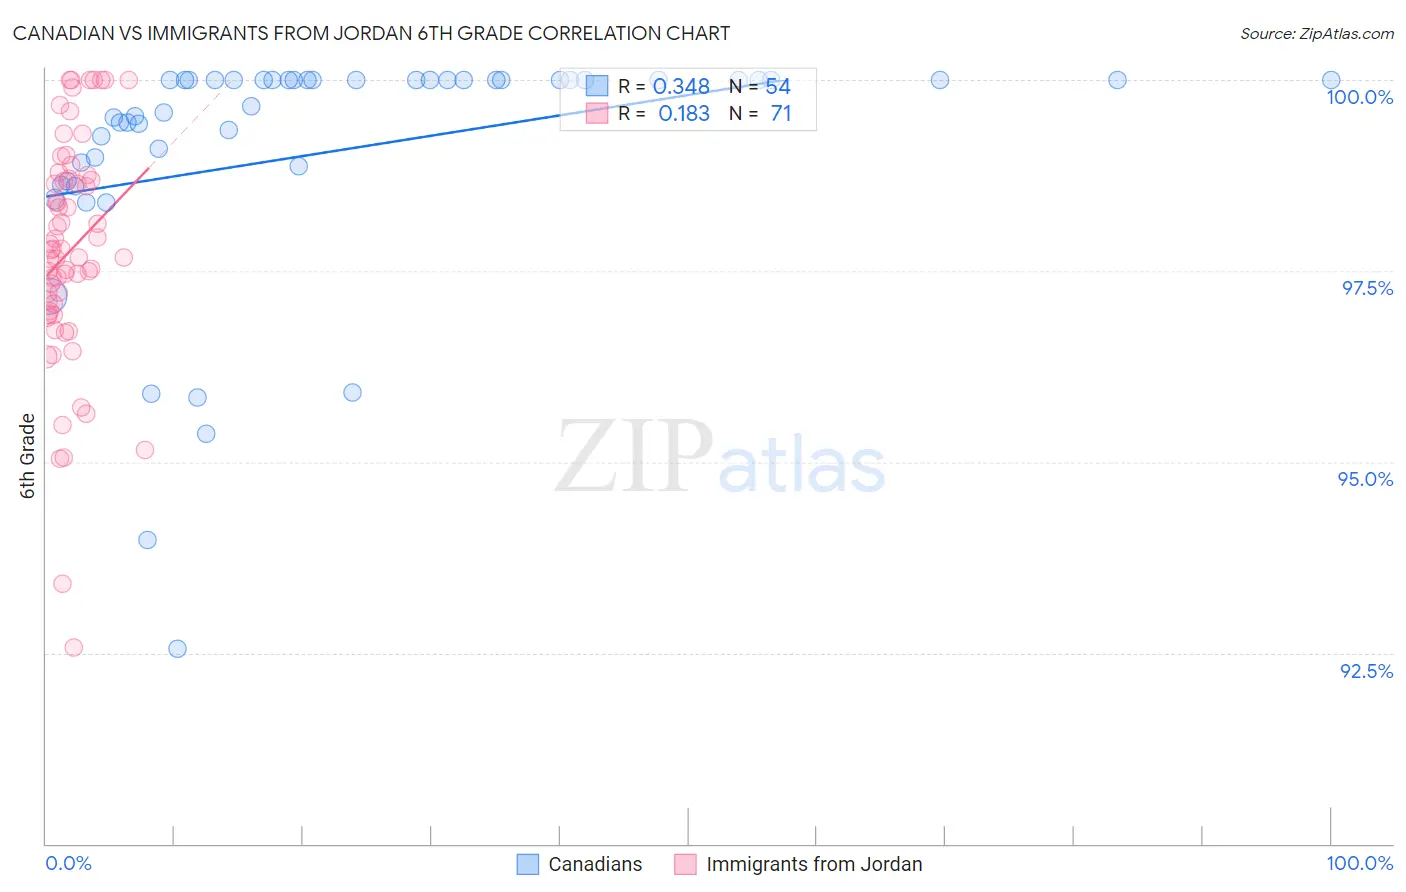
Canadian vs Immigrants from Jordan 6th Grade Correlation Chart
The statistical analysis conducted on geographies consisting of 437,556,929 people shows a mild positive correlation between the proportion of Canadians and percentage of population with at least 6th grade education in the United States with a correlation coefficient (R) of 0.348 and weighted average of 97.7%. Similarly, the statistical analysis conducted on geographies consisting of 181,269,915 people shows a poor positive correlation between the proportion of Immigrants from Jordan and percentage of population with at least 6th grade education in the United States with a correlation coefficient (R) of 0.183 and weighted average of 97.2%, a difference of 0.54%.
6th Grade Correlation Summary
| Measurement | Canadian | Immigrants from Jordan |
| Minimum | 92.6% | 92.6% |
| Maximum | 100.0% | 100.0% |
| Range | 7.4% | 7.4% |
| Mean | 99.1% | 97.8% |
| Median | 100.0% | 97.8% |
| Interquartile 25% (IQ1) | 98.9% | 97.0% |
| Interquartile 75% (IQ3) | 100.0% | 98.7% |
| Interquartile Range (IQR) | 1.1% | 1.7% |
| Standard Deviation (Sample) | 1.6% | 1.5% |
| Standard Deviation (Population) | 1.6% | 1.5% |
Similar Demographics by 6th Grade
Demographics Similar to Canadians by 6th Grade
In terms of 6th grade, the demographic groups most similar to Canadians are Russian (97.7%, a difference of 0.010%), Immigrants from Northern Europe (97.7%, a difference of 0.010%), New Zealander (97.7%, a difference of 0.010%), Immigrants from North America (97.7%, a difference of 0.020%), and Kiowa (97.7%, a difference of 0.020%).
| Demographics | Rating | Rank | 6th Grade |
| Whites/Caucasians | 99.8 /100 | #57 | Exceptional 97.7% |
| Greeks | 99.8 /100 | #58 | Exceptional 97.7% |
| Americans | 99.8 /100 | #59 | Exceptional 97.7% |
| Immigrants | Canada | 99.8 /100 | #60 | Exceptional 97.7% |
| Serbians | 99.7 /100 | #61 | Exceptional 97.7% |
| Immigrants | North America | 99.7 /100 | #62 | Exceptional 97.7% |
| Russians | 99.7 /100 | #63 | Exceptional 97.7% |
| Canadians | 99.7 /100 | #64 | Exceptional 97.7% |
| Immigrants | Northern Europe | 99.6 /100 | #65 | Exceptional 97.7% |
| New Zealanders | 99.6 /100 | #66 | Exceptional 97.7% |
| Kiowa | 99.6 /100 | #67 | Exceptional 97.7% |
| Immigrants | Austria | 99.6 /100 | #68 | Exceptional 97.7% |
| Iranians | 99.6 /100 | #69 | Exceptional 97.6% |
| Cajuns | 99.5 /100 | #70 | Exceptional 97.6% |
| Chickasaw | 99.5 /100 | #71 | Exceptional 97.6% |
Demographics Similar to Immigrants from Jordan by 6th Grade
In terms of 6th grade, the demographic groups most similar to Immigrants from Jordan are Immigrants from Eastern Europe (97.2%, a difference of 0.0%), Immigrants from Bosnia and Herzegovina (97.2%, a difference of 0.010%), French American Indian (97.2%, a difference of 0.010%), Soviet Union (97.2%, a difference of 0.010%), and Ute (97.1%, a difference of 0.010%).
| Demographics | Rating | Rank | 6th Grade |
| Spaniards | 80.1 /100 | #145 | Excellent 97.2% |
| Hopi | 78.8 /100 | #146 | Good 97.2% |
| Immigrants | South Central Asia | 78.1 /100 | #147 | Good 97.2% |
| Immigrants | Greece | 77.8 /100 | #148 | Good 97.2% |
| Immigrants | Israel | 76.0 /100 | #149 | Good 97.2% |
| Immigrants | Bosnia and Herzegovina | 74.8 /100 | #150 | Good 97.2% |
| French American Indians | 74.0 /100 | #151 | Good 97.2% |
| Immigrants | Jordan | 73.0 /100 | #152 | Good 97.2% |
| Immigrants | Eastern Europe | 72.6 /100 | #153 | Good 97.2% |
| Soviet Union | 71.5 /100 | #154 | Good 97.2% |
| Ute | 71.1 /100 | #155 | Good 97.1% |
| Alsatians | 69.8 /100 | #156 | Good 97.1% |
| Immigrants | Russia | 67.6 /100 | #157 | Good 97.1% |
| Immigrants | Iran | 63.3 /100 | #158 | Good 97.1% |
| Kenyans | 62.9 /100 | #159 | Good 97.1% |