Panamanian vs Shoshone 6th Grade
COMPARE
Panamanian
Shoshone
6th Grade
6th Grade Comparison
Panamanians
Shoshone
96.9%
6TH GRADE
27.3/ 100
METRIC RATING
191st/ 347
METRIC RANK
97.6%
6TH GRADE
99.0/ 100
METRIC RATING
84th/ 347
METRIC RANK
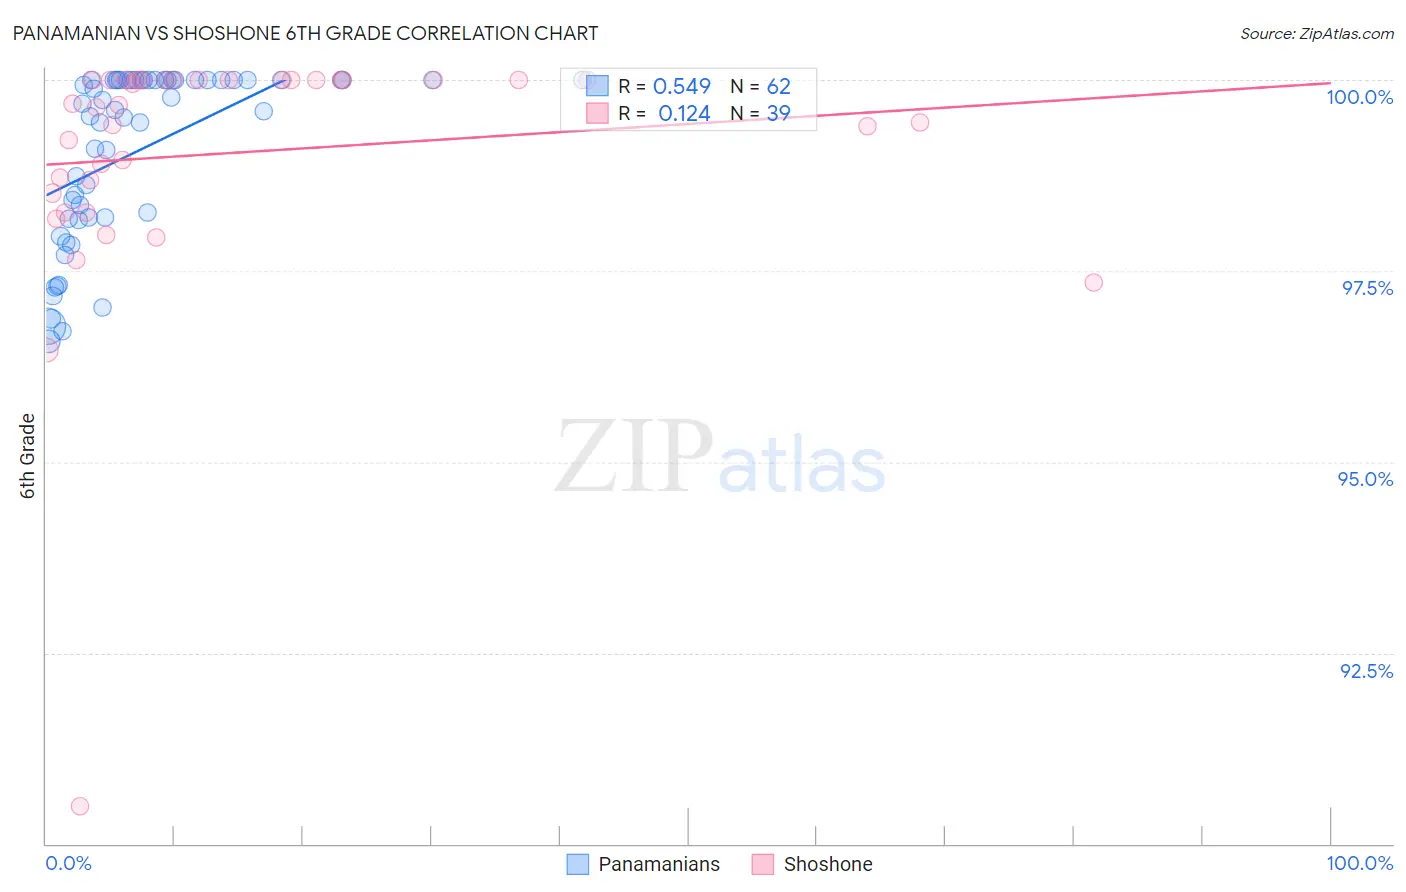
Panamanian vs Shoshone 6th Grade Correlation Chart
The statistical analysis conducted on geographies consisting of 281,248,945 people shows a substantial positive correlation between the proportion of Panamanians and percentage of population with at least 6th grade education in the United States with a correlation coefficient (R) of 0.549 and weighted average of 96.9%. Similarly, the statistical analysis conducted on geographies consisting of 66,625,086 people shows a poor positive correlation between the proportion of Shoshone and percentage of population with at least 6th grade education in the United States with a correlation coefficient (R) of 0.124 and weighted average of 97.6%, a difference of 0.64%.
6th Grade Correlation Summary
| Measurement | Panamanian | Shoshone |
| Minimum | 96.6% | 90.5% |
| Maximum | 100.0% | 100.0% |
| Range | 3.4% | 9.5% |
| Mean | 99.1% | 99.0% |
| Median | 99.6% | 99.7% |
| Interquartile 25% (IQ1) | 98.2% | 98.5% |
| Interquartile 75% (IQ3) | 100.0% | 100.0% |
| Interquartile Range (IQR) | 1.8% | 1.5% |
| Standard Deviation (Sample) | 1.1% | 1.7% |
| Standard Deviation (Population) | 1.1% | 1.7% |
Similar Demographics by 6th Grade
Demographics Similar to Panamanians by 6th Grade
In terms of 6th grade, the demographic groups most similar to Panamanians are Hawaiian (96.9%, a difference of 0.0%), Paraguayan (96.9%, a difference of 0.0%), Dutch West Indian (96.9%, a difference of 0.010%), Immigrants from Lebanon (96.9%, a difference of 0.010%), and Immigrants from Brazil (96.9%, a difference of 0.010%).
| Demographics | Rating | Rank | 6th Grade |
| Spanish Americans | 33.5 /100 | #184 | Fair 97.0% |
| Argentineans | 33.0 /100 | #185 | Fair 97.0% |
| Immigrants | Egypt | 31.4 /100 | #186 | Fair 97.0% |
| Guamanians/Chamorros | 30.6 /100 | #187 | Fair 97.0% |
| Immigrants | Argentina | 30.4 /100 | #188 | Fair 97.0% |
| Blacks/African Americans | 30.2 /100 | #189 | Fair 97.0% |
| Dutch West Indians | 28.3 /100 | #190 | Fair 96.9% |
| Panamanians | 27.3 /100 | #191 | Fair 96.9% |
| Hawaiians | 27.0 /100 | #192 | Fair 96.9% |
| Paraguayans | 26.6 /100 | #193 | Fair 96.9% |
| Immigrants | Lebanon | 25.6 /100 | #194 | Fair 96.9% |
| Immigrants | Brazil | 25.5 /100 | #195 | Fair 96.9% |
| Immigrants | Uganda | 21.2 /100 | #196 | Fair 96.9% |
| Brazilians | 20.1 /100 | #197 | Fair 96.9% |
| Immigrants | Albania | 18.8 /100 | #198 | Poor 96.9% |
Demographics Similar to Shoshone by 6th Grade
In terms of 6th grade, the demographic groups most similar to Shoshone are Zimbabwean (97.6%, a difference of 0.010%), Potawatomi (97.6%, a difference of 0.010%), Delaware (97.6%, a difference of 0.010%), Lumbee (97.6%, a difference of 0.020%), and Immigrants from Belgium (97.5%, a difference of 0.020%).
| Demographics | Rating | Rank | 6th Grade |
| Immigrants | Lithuania | 99.3 /100 | #77 | Exceptional 97.6% |
| Icelanders | 99.3 /100 | #78 | Exceptional 97.6% |
| Immigrants | India | 99.3 /100 | #79 | Exceptional 97.6% |
| Osage | 99.3 /100 | #80 | Exceptional 97.6% |
| Lumbee | 99.2 /100 | #81 | Exceptional 97.6% |
| Zimbabweans | 99.1 /100 | #82 | Exceptional 97.6% |
| Potawatomi | 99.1 /100 | #83 | Exceptional 97.6% |
| Shoshone | 99.0 /100 | #84 | Exceptional 97.6% |
| Delaware | 98.9 /100 | #85 | Exceptional 97.6% |
| Immigrants | Belgium | 98.9 /100 | #86 | Exceptional 97.5% |
| Puget Sound Salish | 98.9 /100 | #87 | Exceptional 97.5% |
| Immigrants | South Africa | 98.9 /100 | #88 | Exceptional 97.5% |
| Immigrants | Australia | 98.8 /100 | #89 | Exceptional 97.5% |
| Pueblo | 98.8 /100 | #90 | Exceptional 97.5% |
| Immigrants | Western Europe | 98.8 /100 | #91 | Exceptional 97.5% |