Canadian vs Carpatho Rusyn 7th Grade
COMPARE
Canadian
Carpatho Rusyn
7th Grade
7th Grade Comparison
Canadians
Carpatho Rusyns
96.9%
7TH GRADE
99.7/ 100
METRIC RATING
65th/ 347
METRIC RANK
98.3%
7TH GRADE
100.0/ 100
METRIC RATING
3rd/ 347
METRIC RANK
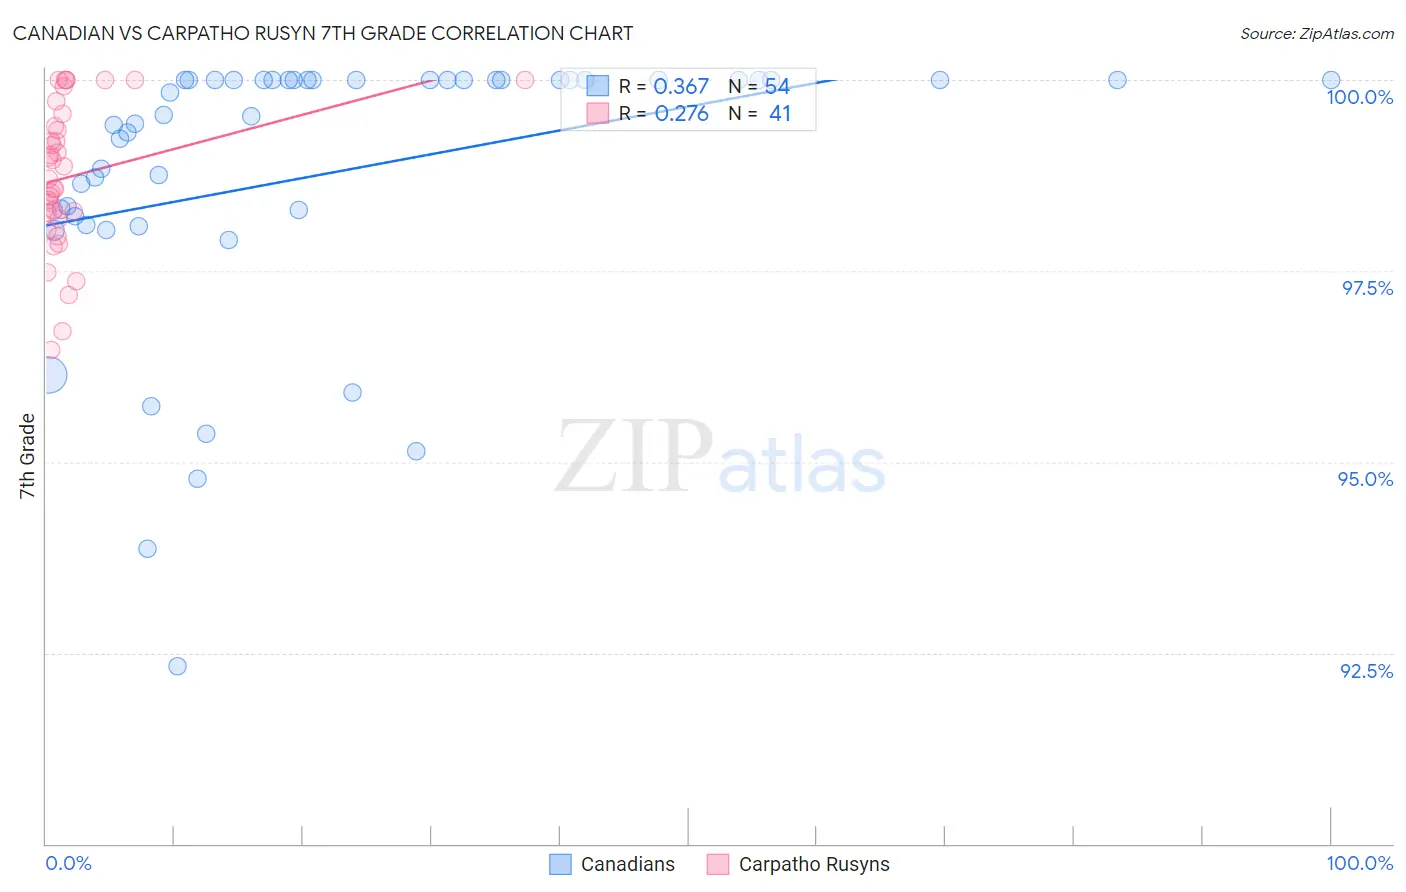
Canadian vs Carpatho Rusyn 7th Grade Correlation Chart
The statistical analysis conducted on geographies consisting of 437,556,929 people shows a mild positive correlation between the proportion of Canadians and percentage of population with at least 7th grade education in the United States with a correlation coefficient (R) of 0.367 and weighted average of 96.9%. Similarly, the statistical analysis conducted on geographies consisting of 10,071,463 people shows a weak positive correlation between the proportion of Carpatho Rusyns and percentage of population with at least 7th grade education in the United States with a correlation coefficient (R) of 0.276 and weighted average of 98.3%, a difference of 1.5%.
7th Grade Correlation Summary
| Measurement | Canadian | Carpatho Rusyn |
| Minimum | 92.3% | 96.5% |
| Maximum | 100.0% | 100.0% |
| Range | 7.7% | 3.5% |
| Mean | 98.8% | 98.7% |
| Median | 99.7% | 98.7% |
| Interquartile 25% (IQ1) | 98.2% | 98.2% |
| Interquartile 75% (IQ3) | 100.0% | 99.5% |
| Interquartile Range (IQR) | 1.8% | 1.3% |
| Standard Deviation (Sample) | 1.8% | 0.94% |
| Standard Deviation (Population) | 1.8% | 0.93% |
Similar Demographics by 7th Grade
Demographics Similar to Canadians by 7th Grade
In terms of 7th grade, the demographic groups most similar to Canadians are Immigrants from Northern Europe (96.9%, a difference of 0.010%), Immigrants from Austria (96.9%, a difference of 0.010%), Ukrainian (96.9%, a difference of 0.020%), Native Hawaiian (96.9%, a difference of 0.020%), and Creek (96.9%, a difference of 0.030%).
| Demographics | Rating | Rank | 7th Grade |
| Whites/Caucasians | 99.8 /100 | #58 | Exceptional 97.0% |
| Macedonians | 99.8 /100 | #59 | Exceptional 97.0% |
| Immigrants | Canada | 99.8 /100 | #60 | Exceptional 96.9% |
| Creek | 99.8 /100 | #61 | Exceptional 96.9% |
| Immigrants | North America | 99.8 /100 | #62 | Exceptional 96.9% |
| Immigrants | Northern Europe | 99.7 /100 | #63 | Exceptional 96.9% |
| Immigrants | Austria | 99.7 /100 | #64 | Exceptional 96.9% |
| Canadians | 99.7 /100 | #65 | Exceptional 96.9% |
| Ukrainians | 99.7 /100 | #66 | Exceptional 96.9% |
| Native Hawaiians | 99.7 /100 | #67 | Exceptional 96.9% |
| Immigrants | India | 99.6 /100 | #68 | Exceptional 96.9% |
| Iranians | 99.6 /100 | #69 | Exceptional 96.8% |
| New Zealanders | 99.6 /100 | #70 | Exceptional 96.8% |
| Immigrants | Lithuania | 99.6 /100 | #71 | Exceptional 96.8% |
| Cajuns | 99.5 /100 | #72 | Exceptional 96.8% |
Demographics Similar to Carpatho Rusyns by 7th Grade
In terms of 7th grade, the demographic groups most similar to Carpatho Rusyns are Finnish (98.5%, a difference of 0.18%), Ottawa (98.1%, a difference of 0.20%), Dutch (97.9%, a difference of 0.46%), Tsimshian (97.8%, a difference of 0.53%), and Norwegian (97.8%, a difference of 0.56%).
| Demographics | Rating | Rank | 7th Grade |
| Crow | 100.0 /100 | #1 | Exceptional 99.1% |
| Finns | 100.0 /100 | #2 | Exceptional 98.5% |
| Carpatho Rusyns | 100.0 /100 | #3 | Exceptional 98.3% |
| Ottawa | 100.0 /100 | #4 | Exceptional 98.1% |
| Dutch | 100.0 /100 | #5 | Exceptional 97.9% |
| Tsimshian | 100.0 /100 | #6 | Exceptional 97.8% |
| Norwegians | 100.0 /100 | #7 | Exceptional 97.8% |
| Slovaks | 100.0 /100 | #8 | Exceptional 97.8% |
| Germans | 100.0 /100 | #9 | Exceptional 97.7% |
| Slovenes | 100.0 /100 | #10 | Exceptional 97.6% |
| Alaskan Athabascans | 100.0 /100 | #11 | Exceptional 97.6% |
| Poles | 100.0 /100 | #12 | Exceptional 97.6% |
| Swedes | 100.0 /100 | #13 | Exceptional 97.6% |
| Pennsylvania Germans | 100.0 /100 | #14 | Exceptional 97.6% |
| English | 100.0 /100 | #15 | Exceptional 97.6% |