Burmese vs Immigrants from El Salvador Professional Degree
COMPARE
Burmese
Immigrants from El Salvador
Professional Degree
Professional Degree Comparison
Burmese
Immigrants from El Salvador
6.1%
PROFESSIONAL DEGREE
100.0/ 100
METRIC RATING
33rd/ 347
METRIC RANK
3.5%
PROFESSIONAL DEGREE
0.3/ 100
METRIC RATING
287th/ 347
METRIC RANK
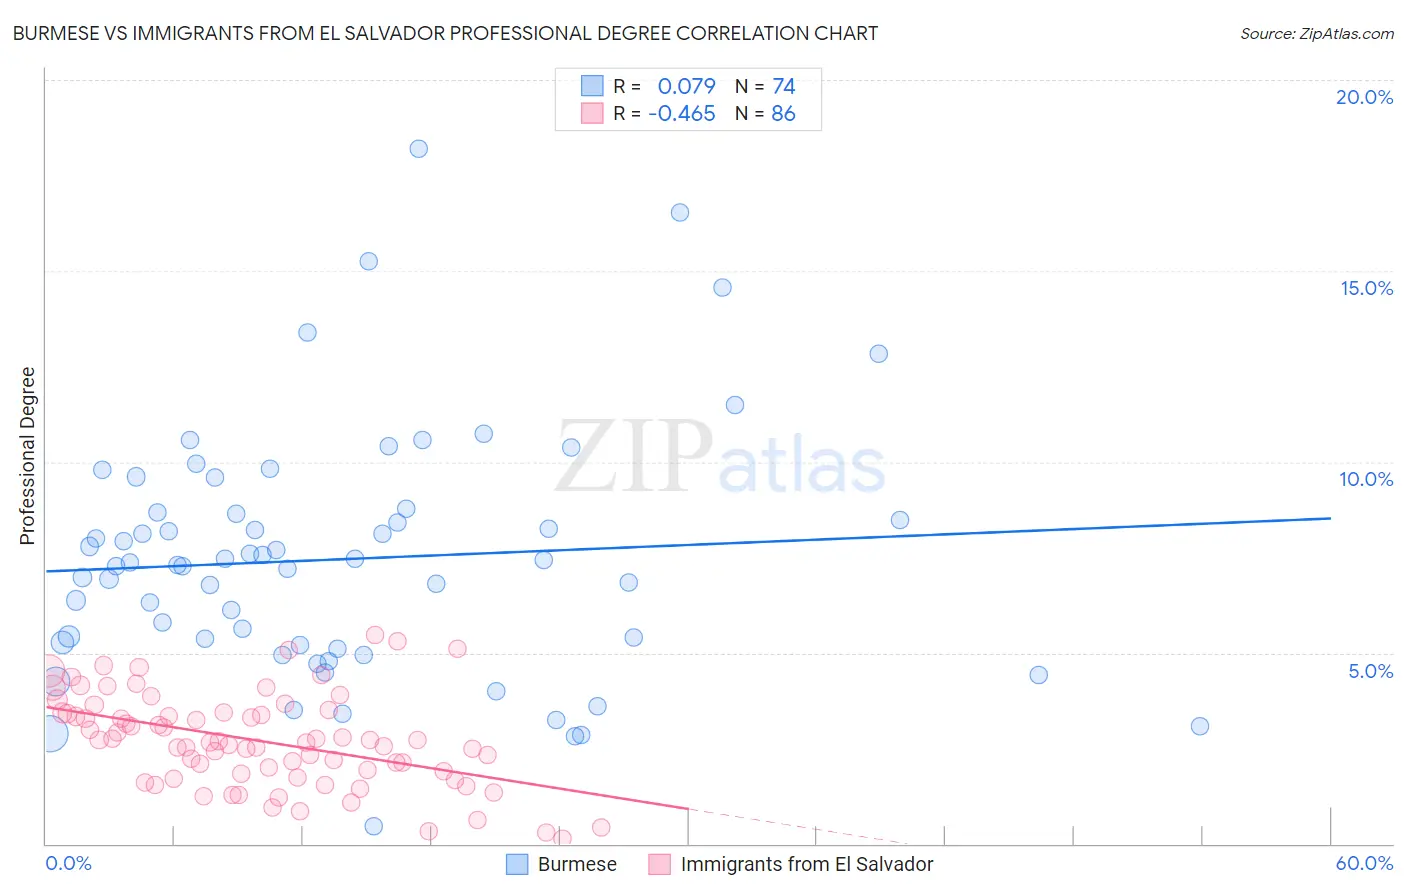
Burmese vs Immigrants from El Salvador Professional Degree Correlation Chart
The statistical analysis conducted on geographies consisting of 463,932,708 people shows a slight positive correlation between the proportion of Burmese and percentage of population with at least professional degree education in the United States with a correlation coefficient (R) of 0.079 and weighted average of 6.1%. Similarly, the statistical analysis conducted on geographies consisting of 356,542,562 people shows a moderate negative correlation between the proportion of Immigrants from El Salvador and percentage of population with at least professional degree education in the United States with a correlation coefficient (R) of -0.465 and weighted average of 3.5%, a difference of 76.7%.
Professional Degree Correlation Summary
| Measurement | Burmese | Immigrants from El Salvador |
| Minimum | 0.47% | 0.14% |
| Maximum | 18.2% | 5.5% |
| Range | 17.7% | 5.3% |
| Mean | 7.5% | 2.7% |
| Median | 7.3% | 2.7% |
| Interquartile 25% (IQ1) | 5.2% | 1.8% |
| Interquartile 75% (IQ3) | 8.7% | 3.4% |
| Interquartile Range (IQR) | 3.5% | 1.6% |
| Standard Deviation (Sample) | 3.3% | 1.2% |
| Standard Deviation (Population) | 3.2% | 1.2% |
Similar Demographics by Professional Degree
Demographics Similar to Burmese by Professional Degree
In terms of professional degree, the demographic groups most similar to Burmese are Thai (6.1%, a difference of 0.030%), Mongolian (6.1%, a difference of 0.13%), Immigrants from India (6.2%, a difference of 0.27%), Immigrants from Sri Lanka (6.2%, a difference of 0.39%), and Immigrants from Turkey (6.2%, a difference of 0.39%).
| Demographics | Rating | Rank | Professional Degree |
| Latvians | 100.0 /100 | #26 | Exceptional 6.2% |
| Immigrants | Northern Europe | 100.0 /100 | #27 | Exceptional 6.2% |
| Turks | 100.0 /100 | #28 | Exceptional 6.2% |
| Immigrants | Sri Lanka | 100.0 /100 | #29 | Exceptional 6.2% |
| Immigrants | Turkey | 100.0 /100 | #30 | Exceptional 6.2% |
| Immigrants | India | 100.0 /100 | #31 | Exceptional 6.2% |
| Thais | 100.0 /100 | #32 | Exceptional 6.1% |
| Burmese | 100.0 /100 | #33 | Exceptional 6.1% |
| Mongolians | 100.0 /100 | #34 | Exceptional 6.1% |
| Immigrants | Korea | 100.0 /100 | #35 | Exceptional 6.1% |
| Immigrants | Russia | 100.0 /100 | #36 | Exceptional 6.0% |
| Immigrants | Austria | 100.0 /100 | #37 | Exceptional 6.0% |
| Immigrants | Norway | 100.0 /100 | #38 | Exceptional 6.0% |
| Immigrants | South Africa | 100.0 /100 | #39 | Exceptional 6.0% |
| Cambodians | 100.0 /100 | #40 | Exceptional 6.0% |
Demographics Similar to Immigrants from El Salvador by Professional Degree
In terms of professional degree, the demographic groups most similar to Immigrants from El Salvador are Blackfeet (3.5%, a difference of 0.050%), Haitian (3.5%, a difference of 0.10%), Guatemalan (3.5%, a difference of 0.22%), Chippewa (3.5%, a difference of 0.23%), and Alaska Native (3.5%, a difference of 0.41%).
| Demographics | Rating | Rank | Professional Degree |
| Dominicans | 0.5 /100 | #280 | Tragic 3.5% |
| Apache | 0.5 /100 | #281 | Tragic 3.5% |
| Immigrants | Caribbean | 0.5 /100 | #282 | Tragic 3.5% |
| Comanche | 0.4 /100 | #283 | Tragic 3.5% |
| Salvadorans | 0.4 /100 | #284 | Tragic 3.5% |
| Hondurans | 0.3 /100 | #285 | Tragic 3.5% |
| Haitians | 0.3 /100 | #286 | Tragic 3.5% |
| Immigrants | El Salvador | 0.3 /100 | #287 | Tragic 3.5% |
| Blackfeet | 0.3 /100 | #288 | Tragic 3.5% |
| Guatemalans | 0.3 /100 | #289 | Tragic 3.5% |
| Chippewa | 0.3 /100 | #290 | Tragic 3.5% |
| Alaska Natives | 0.3 /100 | #291 | Tragic 3.5% |
| Immigrants | Belize | 0.3 /100 | #292 | Tragic 3.5% |
| Immigrants | Honduras | 0.3 /100 | #293 | Tragic 3.5% |
| Paiute | 0.3 /100 | #294 | Tragic 3.4% |