Samoan vs Immigrants from Kenya 7th Grade
COMPARE
Samoan
Immigrants from Kenya
7th Grade
7th Grade Comparison
Samoans
Immigrants from Kenya
95.7%
7TH GRADE
7.0/ 100
METRIC RATING
221st/ 347
METRIC RANK
96.1%
7TH GRADE
66.8/ 100
METRIC RATING
160th/ 347
METRIC RANK
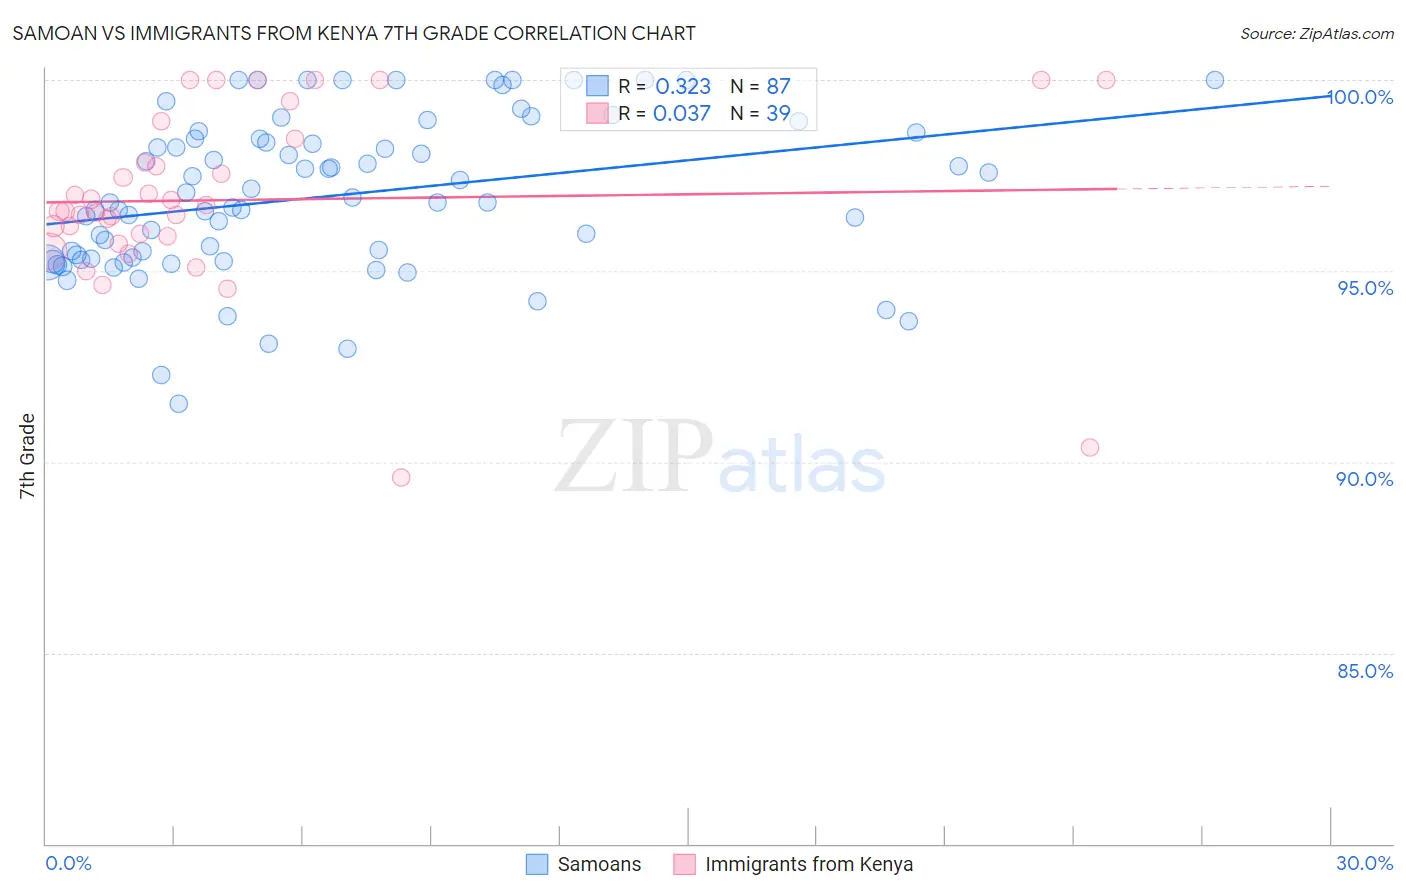
Samoan vs Immigrants from Kenya 7th Grade Correlation Chart
The statistical analysis conducted on geographies consisting of 225,201,909 people shows a mild positive correlation between the proportion of Samoans and percentage of population with at least 7th grade education in the United States with a correlation coefficient (R) of 0.323 and weighted average of 95.7%. Similarly, the statistical analysis conducted on geographies consisting of 218,076,690 people shows no correlation between the proportion of Immigrants from Kenya and percentage of population with at least 7th grade education in the United States with a correlation coefficient (R) of 0.037 and weighted average of 96.1%, a difference of 0.51%.
7th Grade Correlation Summary
| Measurement | Samoan | Immigrants from Kenya |
| Minimum | 91.5% | 89.6% |
| Maximum | 100.0% | 100.0% |
| Range | 8.5% | 10.4% |
| Mean | 97.0% | 96.9% |
| Median | 96.8% | 96.6% |
| Interquartile 25% (IQ1) | 95.3% | 95.9% |
| Interquartile 75% (IQ3) | 98.5% | 98.5% |
| Interquartile Range (IQR) | 3.1% | 2.6% |
| Standard Deviation (Sample) | 2.0% | 2.3% |
| Standard Deviation (Population) | 2.0% | 2.3% |
Similar Demographics by 7th Grade
Demographics Similar to Samoans by 7th Grade
In terms of 7th grade, the demographic groups most similar to Samoans are Subsaharan African (95.7%, a difference of 0.0%), Laotian (95.7%, a difference of 0.0%), Immigrants from Syria (95.7%, a difference of 0.010%), Immigrants from Oceania (95.7%, a difference of 0.010%), and Immigrants from Liberia (95.7%, a difference of 0.020%).
| Demographics | Rating | Rank | 7th Grade |
| Bahamians | 11.6 /100 | #214 | Poor 95.7% |
| Spanish Americans | 9.3 /100 | #215 | Tragic 95.7% |
| Immigrants | Chile | 9.1 /100 | #216 | Tragic 95.7% |
| Immigrants | Pakistan | 9.0 /100 | #217 | Tragic 95.7% |
| Immigrants | Liberia | 8.1 /100 | #218 | Tragic 95.7% |
| Immigrants | Southern Europe | 7.9 /100 | #219 | Tragic 95.7% |
| Sub-Saharan Africans | 7.2 /100 | #220 | Tragic 95.7% |
| Samoans | 7.0 /100 | #221 | Tragic 95.7% |
| Laotians | 6.8 /100 | #222 | Tragic 95.7% |
| Immigrants | Syria | 6.7 /100 | #223 | Tragic 95.7% |
| Immigrants | Oceania | 6.7 /100 | #224 | Tragic 95.7% |
| Immigrants | Malaysia | 6.2 /100 | #225 | Tragic 95.6% |
| Immigrants | Eastern Asia | 5.8 /100 | #226 | Tragic 95.6% |
| Immigrants | Western Asia | 5.4 /100 | #227 | Tragic 95.6% |
| Immigrants | Eastern Africa | 5.1 /100 | #228 | Tragic 95.6% |
Demographics Similar to Immigrants from Kenya by 7th Grade
In terms of 7th grade, the demographic groups most similar to Immigrants from Kenya are Alsatian (96.1%, a difference of 0.0%), Bermudan (96.1%, a difference of 0.0%), Arab (96.2%, a difference of 0.010%), Pima (96.1%, a difference of 0.020%), and Spaniard (96.1%, a difference of 0.030%).
| Demographics | Rating | Rank | 7th Grade |
| Seminole | 78.1 /100 | #153 | Good 96.2% |
| Immigrants | Israel | 77.6 /100 | #154 | Good 96.2% |
| Immigrants | Jordan | 77.0 /100 | #155 | Good 96.2% |
| Kenyans | 76.2 /100 | #156 | Good 96.2% |
| Ugandans | 75.5 /100 | #157 | Good 96.2% |
| Arabs | 68.6 /100 | #158 | Good 96.2% |
| Alsatians | 67.2 /100 | #159 | Good 96.1% |
| Immigrants | Kenya | 66.8 /100 | #160 | Good 96.1% |
| Bermudans | 66.3 /100 | #161 | Good 96.1% |
| Pima | 64.3 /100 | #162 | Good 96.1% |
| Spaniards | 62.6 /100 | #163 | Good 96.1% |
| Immigrants | Italy | 62.1 /100 | #164 | Good 96.1% |
| Immigrants | Taiwan | 61.5 /100 | #165 | Good 96.1% |
| Immigrants | Kazakhstan | 61.0 /100 | #166 | Good 96.1% |
| Immigrants | Sri Lanka | 59.9 /100 | #167 | Average 96.1% |