Immigrants from Belize vs Immigrants from Guyana No Schooling Completed
COMPARE
Immigrants from Belize
Immigrants from Guyana
No Schooling Completed
No Schooling Completed Comparison
Immigrants from Belize
Immigrants from Guyana
3.1%
NO SCHOOLING COMPLETED
0.0/ 100
METRIC RATING
314th/ 347
METRIC RANK
3.1%
NO SCHOOLING COMPLETED
0.0/ 100
METRIC RATING
318th/ 347
METRIC RANK
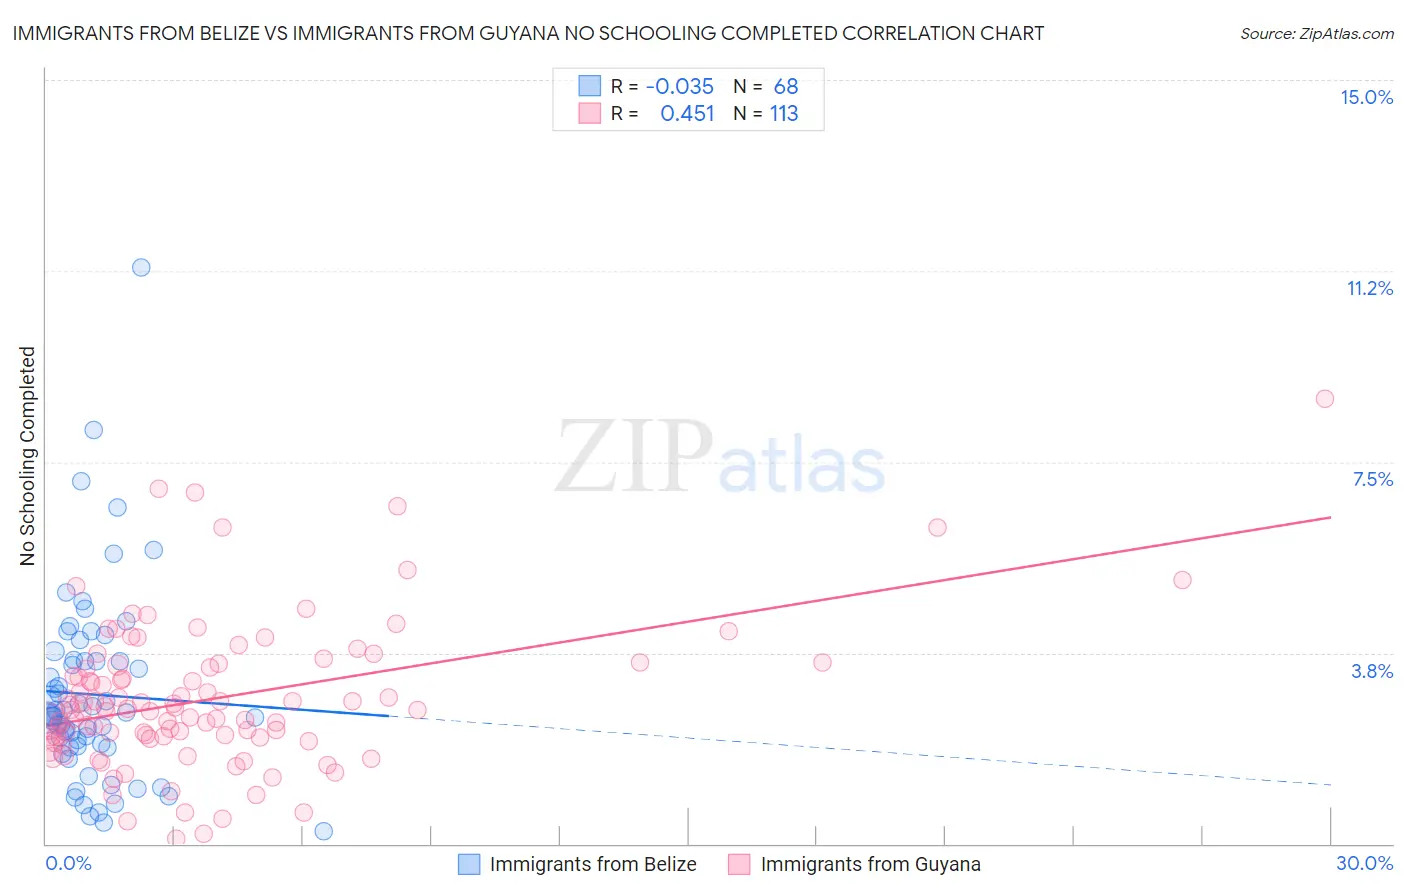
Immigrants from Belize vs Immigrants from Guyana No Schooling Completed Correlation Chart
The statistical analysis conducted on geographies consisting of 130,082,075 people shows no correlation between the proportion of Immigrants from Belize and percentage of population with no schooling in the United States with a correlation coefficient (R) of -0.035 and weighted average of 3.1%. Similarly, the statistical analysis conducted on geographies consisting of 183,181,054 people shows a moderate positive correlation between the proportion of Immigrants from Guyana and percentage of population with no schooling in the United States with a correlation coefficient (R) of 0.451 and weighted average of 3.1%, a difference of 1.8%.
No Schooling Completed Correlation Summary
| Measurement | Immigrants from Belize | Immigrants from Guyana |
| Minimum | 0.25% | 0.10% |
| Maximum | 11.3% | 8.7% |
| Range | 11.1% | 8.6% |
| Mean | 2.9% | 2.9% |
| Median | 2.5% | 2.6% |
| Interquartile 25% (IQ1) | 1.9% | 2.1% |
| Interquartile 75% (IQ3) | 3.6% | 3.5% |
| Interquartile Range (IQR) | 1.7% | 1.4% |
| Standard Deviation (Sample) | 1.9% | 1.4% |
| Standard Deviation (Population) | 1.9% | 1.4% |
Demographics Similar to Immigrants from Belize and Immigrants from Guyana by No Schooling Completed
In terms of no schooling completed, the demographic groups most similar to Immigrants from Belize are Honduran (3.1%, a difference of 0.090%), Immigrants from Nicaragua (3.1%, a difference of 0.24%), Sri Lankan (3.0%, a difference of 0.60%), Immigrants from Ecuador (3.1%, a difference of 0.60%), and Immigrants from the Azores (3.0%, a difference of 0.88%). Similarly, the demographic groups most similar to Immigrants from Guyana are Cape Verdean (3.1%, a difference of 0.68%), Immigrants from Burma/Myanmar (3.1%, a difference of 0.74%), Immigrants from Bangladesh (3.1%, a difference of 0.78%), Immigrants from Laos (3.1%, a difference of 0.89%), and Immigrants from Ecuador (3.1%, a difference of 1.2%).
| Demographics | Rating | Rank | No Schooling Completed |
| Belizeans | 0.0 /100 | #306 | Tragic 3.0% |
| Immigrants | Haiti | 0.0 /100 | #307 | Tragic 3.0% |
| Immigrants | Somalia | 0.0 /100 | #308 | Tragic 3.0% |
| Hispanics or Latinos | 0.0 /100 | #309 | Tragic 3.0% |
| Guyanese | 0.0 /100 | #310 | Tragic 3.0% |
| Immigrants | Azores | 0.0 /100 | #311 | Tragic 3.0% |
| Sri Lankans | 0.0 /100 | #312 | Tragic 3.0% |
| Hondurans | 0.0 /100 | #313 | Tragic 3.1% |
| Immigrants | Belize | 0.0 /100 | #314 | Tragic 3.1% |
| Immigrants | Nicaragua | 0.0 /100 | #315 | Tragic 3.1% |
| Immigrants | Ecuador | 0.0 /100 | #316 | Tragic 3.1% |
| Cape Verdeans | 0.0 /100 | #317 | Tragic 3.1% |
| Immigrants | Guyana | 0.0 /100 | #318 | Tragic 3.1% |
| Immigrants | Burma/Myanmar | 0.0 /100 | #319 | Tragic 3.1% |
| Immigrants | Bangladesh | 0.0 /100 | #320 | Tragic 3.1% |
| Immigrants | Laos | 0.0 /100 | #321 | Tragic 3.1% |
| Immigrants | Honduras | 0.0 /100 | #322 | Tragic 3.2% |
| Vietnamese | 0.0 /100 | #323 | Tragic 3.2% |
| Mexican American Indians | 0.0 /100 | #324 | Tragic 3.2% |
| Dominicans | 0.0 /100 | #325 | Tragic 3.2% |
| Indonesians | 0.0 /100 | #326 | Tragic 3.2% |