British West Indian vs Immigrants from Ghana 7th Grade
COMPARE
British West Indian
Immigrants from Ghana
7th Grade
7th Grade Comparison
British West Indians
Immigrants from Ghana
94.8%
7TH GRADE
0.0/ 100
METRIC RATING
288th/ 347
METRIC RANK
95.2%
7TH GRADE
0.3/ 100
METRIC RATING
266th/ 347
METRIC RANK
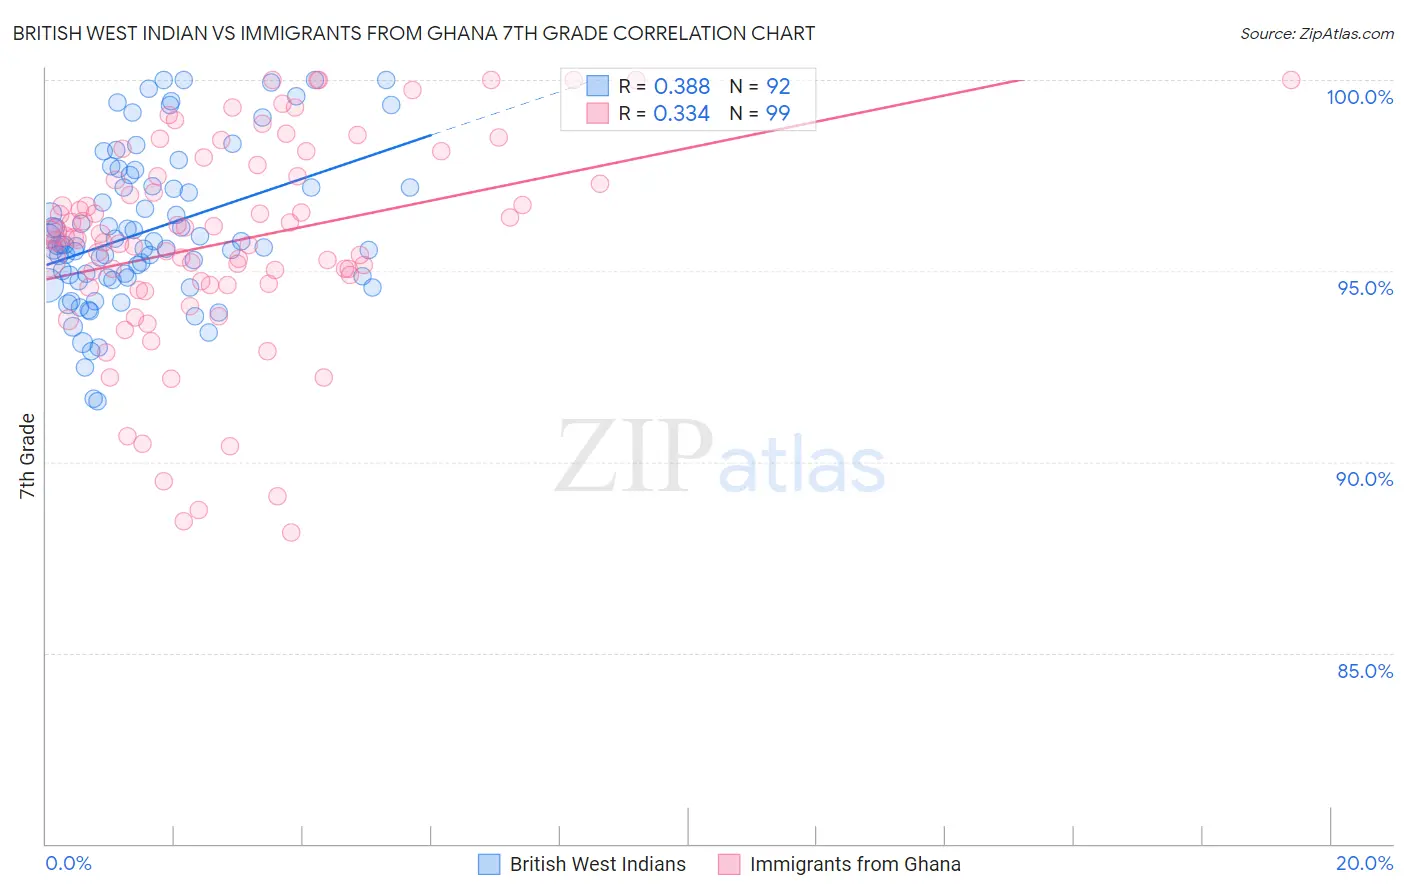
British West Indian vs Immigrants from Ghana 7th Grade Correlation Chart
The statistical analysis conducted on geographies consisting of 152,691,173 people shows a mild positive correlation between the proportion of British West Indians and percentage of population with at least 7th grade education in the United States with a correlation coefficient (R) of 0.388 and weighted average of 94.8%. Similarly, the statistical analysis conducted on geographies consisting of 199,952,023 people shows a mild positive correlation between the proportion of Immigrants from Ghana and percentage of population with at least 7th grade education in the United States with a correlation coefficient (R) of 0.334 and weighted average of 95.2%, a difference of 0.37%.
7th Grade Correlation Summary
| Measurement | British West Indian | Immigrants from Ghana |
| Minimum | 91.6% | 88.2% |
| Maximum | 100.0% | 100.0% |
| Range | 8.4% | 11.8% |
| Mean | 96.1% | 95.8% |
| Median | 95.7% | 95.9% |
| Interquartile 25% (IQ1) | 94.8% | 94.6% |
| Interquartile 75% (IQ3) | 97.2% | 97.5% |
| Interquartile Range (IQR) | 2.4% | 2.8% |
| Standard Deviation (Sample) | 2.0% | 2.7% |
| Standard Deviation (Population) | 2.0% | 2.7% |
Similar Demographics by 7th Grade
Demographics Similar to British West Indians by 7th Grade
In terms of 7th grade, the demographic groups most similar to British West Indians are Taiwanese (94.8%, a difference of 0.010%), Immigrants from Peru (94.9%, a difference of 0.020%), Immigrants from Philippines (94.9%, a difference of 0.030%), Malaysian (94.8%, a difference of 0.030%), and Immigrants from Grenada (94.8%, a difference of 0.070%).
| Demographics | Rating | Rank | 7th Grade |
| Tohono O'odham | 0.1 /100 | #281 | Tragic 95.0% |
| Immigrants | Bolivia | 0.1 /100 | #282 | Tragic 95.0% |
| Immigrants | Barbados | 0.1 /100 | #283 | Tragic 95.0% |
| Armenians | 0.1 /100 | #284 | Tragic 95.0% |
| Immigrants | Eritrea | 0.1 /100 | #285 | Tragic 94.9% |
| Immigrants | Philippines | 0.0 /100 | #286 | Tragic 94.9% |
| Immigrants | Peru | 0.0 /100 | #287 | Tragic 94.9% |
| British West Indians | 0.0 /100 | #288 | Tragic 94.8% |
| Taiwanese | 0.0 /100 | #289 | Tragic 94.8% |
| Malaysians | 0.0 /100 | #290 | Tragic 94.8% |
| Immigrants | Grenada | 0.0 /100 | #291 | Tragic 94.8% |
| Immigrants | West Indies | 0.0 /100 | #292 | Tragic 94.8% |
| Fijians | 0.0 /100 | #293 | Tragic 94.7% |
| Haitians | 0.0 /100 | #294 | Tragic 94.7% |
| Yaqui | 0.0 /100 | #295 | Tragic 94.6% |
Demographics Similar to Immigrants from Ghana by 7th Grade
In terms of 7th grade, the demographic groups most similar to Immigrants from Ghana are Immigrants from Uruguay (95.2%, a difference of 0.0%), Yuman (95.2%, a difference of 0.010%), Immigrants from Hong Kong (95.2%, a difference of 0.020%), Immigrants from Nigeria (95.2%, a difference of 0.040%), and Trinidadian and Tobagonian (95.2%, a difference of 0.040%).
| Demographics | Rating | Rank | 7th Grade |
| Immigrants | Costa Rica | 0.6 /100 | #259 | Tragic 95.3% |
| Afghans | 0.5 /100 | #260 | Tragic 95.3% |
| South Americans | 0.5 /100 | #261 | Tragic 95.2% |
| Immigrants | Somalia | 0.5 /100 | #262 | Tragic 95.2% |
| West Indians | 0.5 /100 | #263 | Tragic 95.2% |
| Immigrants | Nigeria | 0.4 /100 | #264 | Tragic 95.2% |
| Immigrants | Uruguay | 0.3 /100 | #265 | Tragic 95.2% |
| Immigrants | Ghana | 0.3 /100 | #266 | Tragic 95.2% |
| Yuman | 0.3 /100 | #267 | Tragic 95.2% |
| Immigrants | Hong Kong | 0.3 /100 | #268 | Tragic 95.2% |
| Trinidadians and Tobagonians | 0.3 /100 | #269 | Tragic 95.2% |
| Houma | 0.2 /100 | #270 | Tragic 95.1% |
| Immigrants | South America | 0.2 /100 | #271 | Tragic 95.1% |
| Peruvians | 0.2 /100 | #272 | Tragic 95.1% |
| Immigrants | Uzbekistan | 0.2 /100 | #273 | Tragic 95.1% |