Immigrants from Somalia vs Immigrants from Europe College, Under 1 year
COMPARE
Immigrants from Somalia
Immigrants from Europe
College, Under 1 year
College, Under 1 year Comparison
Immigrants from Somalia
Immigrants from Europe
65.6%
COLLEGE, UNDER 1 YEAR
56.4/ 100
METRIC RATING
167th/ 347
METRIC RANK
68.8%
COLLEGE, UNDER 1 YEAR
99.1/ 100
METRIC RATING
71st/ 347
METRIC RANK
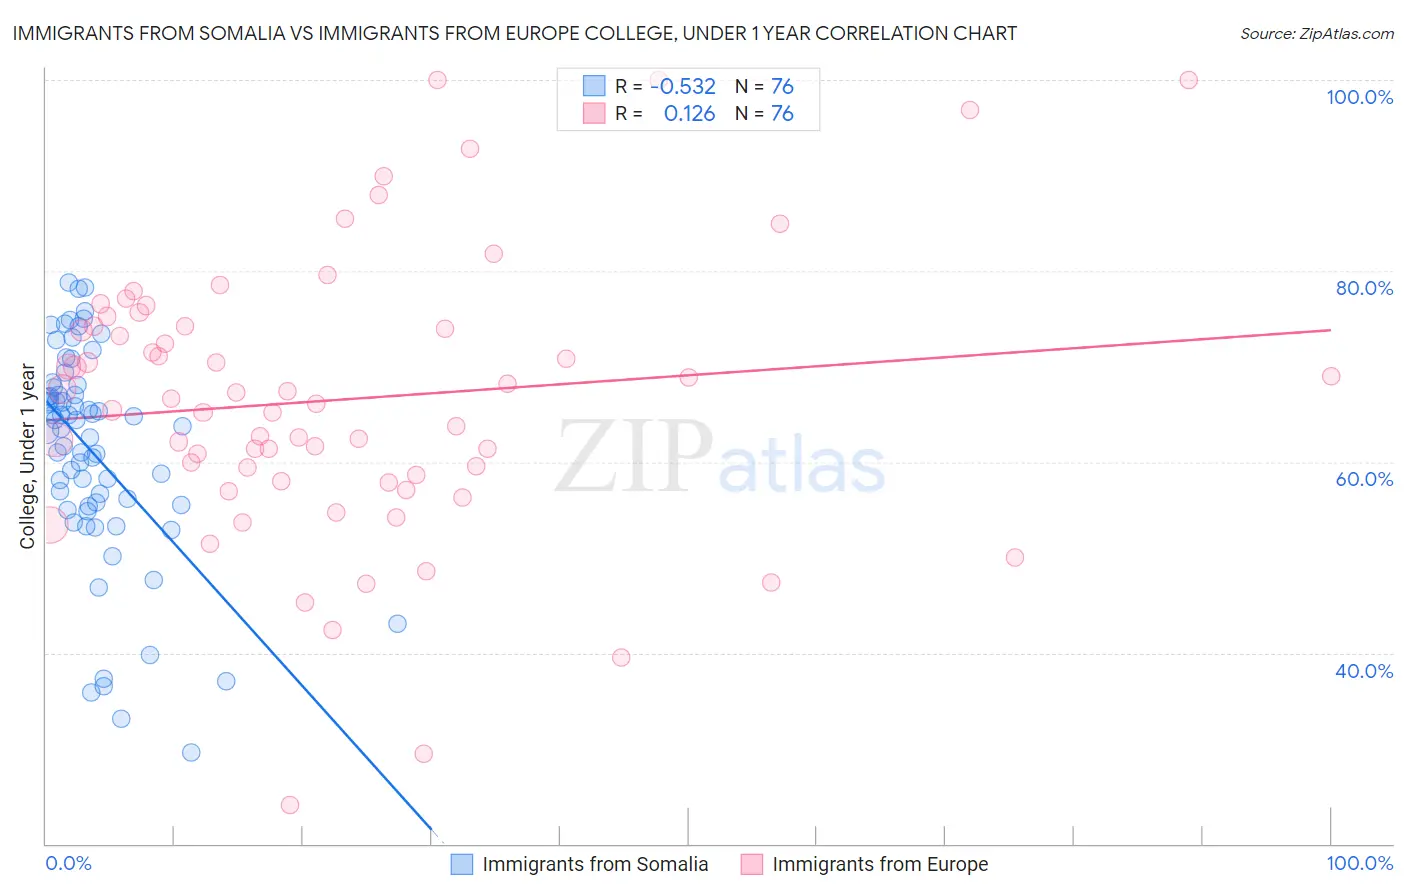
Immigrants from Somalia vs Immigrants from Europe College, Under 1 year Correlation Chart
The statistical analysis conducted on geographies consisting of 92,111,755 people shows a substantial negative correlation between the proportion of Immigrants from Somalia and percentage of population with at least college, under 1 year education in the United States with a correlation coefficient (R) of -0.532 and weighted average of 65.6%. Similarly, the statistical analysis conducted on geographies consisting of 547,420,628 people shows a poor positive correlation between the proportion of Immigrants from Europe and percentage of population with at least college, under 1 year education in the United States with a correlation coefficient (R) of 0.126 and weighted average of 68.8%, a difference of 4.8%.
College, Under 1 year Correlation Summary
| Measurement | Immigrants from Somalia | Immigrants from Europe |
| Minimum | 29.5% | 24.0% |
| Maximum | 78.8% | 100.0% |
| Range | 49.3% | 76.0% |
| Mean | 60.9% | 66.5% |
| Median | 63.6% | 66.3% |
| Interquartile 25% (IQ1) | 55.4% | 58.3% |
| Interquartile 75% (IQ3) | 67.4% | 74.2% |
| Interquartile Range (IQR) | 12.0% | 16.0% |
| Standard Deviation (Sample) | 11.2% | 14.7% |
| Standard Deviation (Population) | 11.1% | 14.6% |
Similar Demographics by College, Under 1 year
Demographics Similar to Immigrants from Somalia by College, Under 1 year
In terms of college, under 1 year, the demographic groups most similar to Immigrants from Somalia are Moroccan (65.6%, a difference of 0.010%), Hungarian (65.6%, a difference of 0.020%), Yugoslavian (65.6%, a difference of 0.030%), German (65.6%, a difference of 0.030%), and Immigrants from Oceania (65.6%, a difference of 0.060%).
| Demographics | Rating | Rank | College, Under 1 year |
| Albanians | 66.1 /100 | #160 | Good 65.9% |
| Brazilians | 66.0 /100 | #161 | Good 65.9% |
| Koreans | 65.3 /100 | #162 | Good 65.9% |
| Somalis | 62.7 /100 | #163 | Good 65.8% |
| Czechoslovakians | 62.6 /100 | #164 | Good 65.8% |
| Immigrants | Uzbekistan | 61.6 /100 | #165 | Good 65.8% |
| Moroccans | 56.7 /100 | #166 | Average 65.6% |
| Immigrants | Somalia | 56.4 /100 | #167 | Average 65.6% |
| Hungarians | 55.9 /100 | #168 | Average 65.6% |
| Yugoslavians | 55.7 /100 | #169 | Average 65.6% |
| Germans | 55.7 /100 | #170 | Average 65.6% |
| Immigrants | Oceania | 55.0 /100 | #171 | Average 65.6% |
| South American Indians | 54.4 /100 | #172 | Average 65.5% |
| Swiss | 53.9 /100 | #173 | Average 65.5% |
| Immigrants | Bosnia and Herzegovina | 50.0 /100 | #174 | Average 65.4% |
Demographics Similar to Immigrants from Europe by College, Under 1 year
In terms of college, under 1 year, the demographic groups most similar to Immigrants from Europe are Lithuanian (68.8%, a difference of 0.010%), Bolivian (68.7%, a difference of 0.040%), Immigrants from England (68.7%, a difference of 0.080%), Swedish (68.7%, a difference of 0.14%), and Immigrants from Romania (68.9%, a difference of 0.18%).
| Demographics | Rating | Rank | College, Under 1 year |
| Northern Europeans | 99.4 /100 | #64 | Exceptional 69.0% |
| Immigrants | Moldova | 99.3 /100 | #65 | Exceptional 69.0% |
| Immigrants | North America | 99.3 /100 | #66 | Exceptional 69.0% |
| Immigrants | Zimbabwe | 99.2 /100 | #67 | Exceptional 68.9% |
| Immigrants | Indonesia | 99.2 /100 | #68 | Exceptional 68.9% |
| Immigrants | Romania | 99.2 /100 | #69 | Exceptional 68.9% |
| Lithuanians | 99.1 /100 | #70 | Exceptional 68.8% |
| Immigrants | Europe | 99.1 /100 | #71 | Exceptional 68.8% |
| Bolivians | 99.0 /100 | #72 | Exceptional 68.7% |
| Immigrants | England | 99.0 /100 | #73 | Exceptional 68.7% |
| Swedes | 98.9 /100 | #74 | Exceptional 68.7% |
| Immigrants | Western Europe | 98.6 /100 | #75 | Exceptional 68.5% |
| Laotians | 98.6 /100 | #76 | Exceptional 68.5% |
| British | 98.6 /100 | #77 | Exceptional 68.5% |
| Danes | 98.6 /100 | #78 | Exceptional 68.5% |