Immigrants from Brazil vs Immigrants from Europe College, Under 1 year
COMPARE
Immigrants from Brazil
Immigrants from Europe
College, Under 1 year
College, Under 1 year Comparison
Immigrants from Brazil
Immigrants from Europe
66.9%
COLLEGE, UNDER 1 YEAR
88.3/ 100
METRIC RATING
133rd/ 347
METRIC RANK
68.8%
COLLEGE, UNDER 1 YEAR
99.1/ 100
METRIC RATING
71st/ 347
METRIC RANK
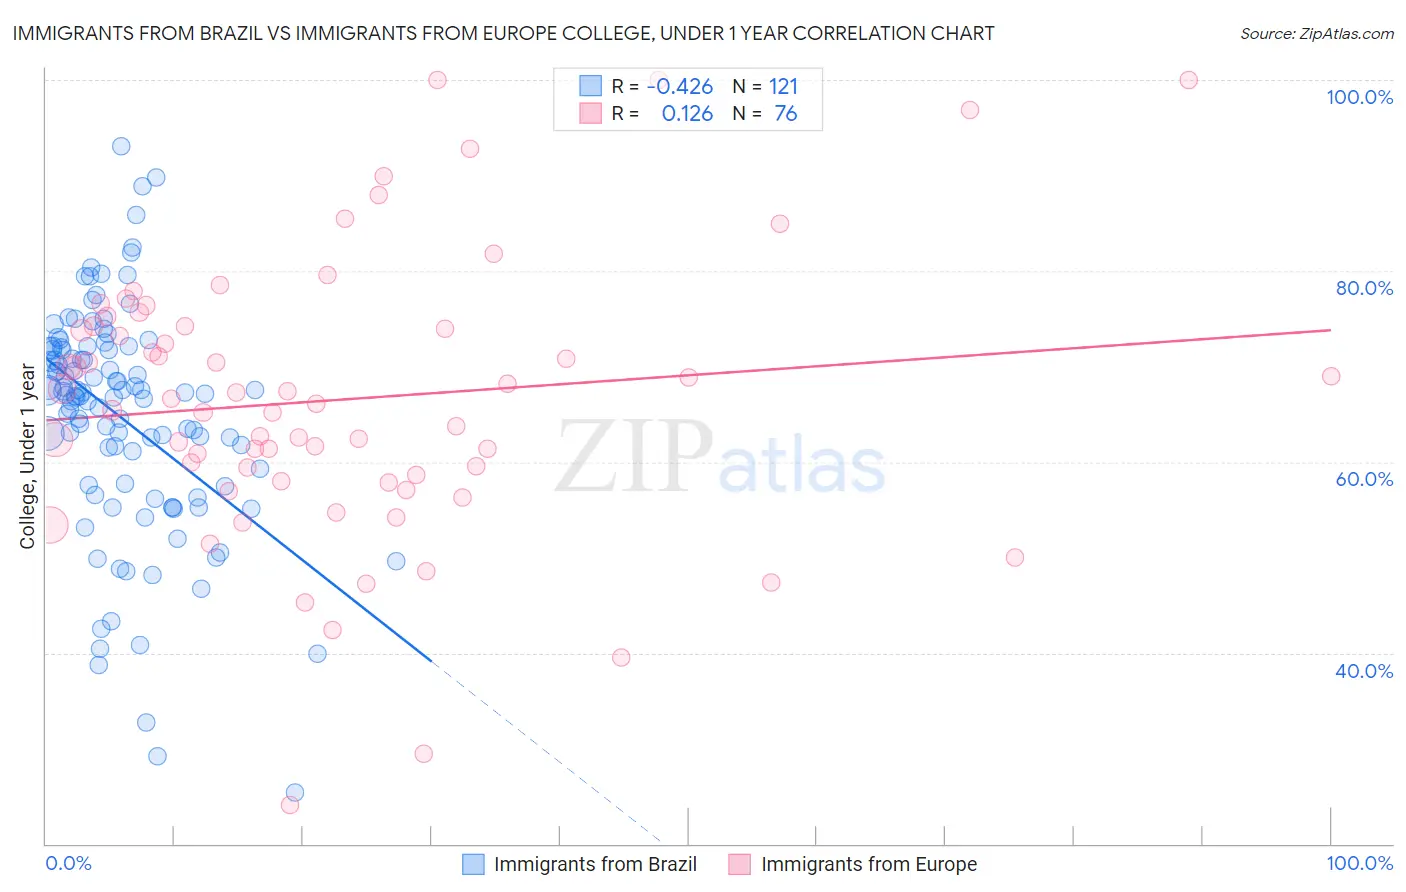
Immigrants from Brazil vs Immigrants from Europe College, Under 1 year Correlation Chart
The statistical analysis conducted on geographies consisting of 343,021,697 people shows a moderate negative correlation between the proportion of Immigrants from Brazil and percentage of population with at least college, under 1 year education in the United States with a correlation coefficient (R) of -0.426 and weighted average of 66.9%. Similarly, the statistical analysis conducted on geographies consisting of 547,420,628 people shows a poor positive correlation between the proportion of Immigrants from Europe and percentage of population with at least college, under 1 year education in the United States with a correlation coefficient (R) of 0.126 and weighted average of 68.8%, a difference of 2.8%.
College, Under 1 year Correlation Summary
| Measurement | Immigrants from Brazil | Immigrants from Europe |
| Minimum | 25.4% | 24.0% |
| Maximum | 93.0% | 100.0% |
| Range | 67.7% | 76.0% |
| Mean | 64.6% | 66.5% |
| Median | 67.0% | 66.3% |
| Interquartile 25% (IQ1) | 57.5% | 58.3% |
| Interquartile 75% (IQ3) | 71.9% | 74.2% |
| Interquartile Range (IQR) | 14.4% | 16.0% |
| Standard Deviation (Sample) | 12.0% | 14.7% |
| Standard Deviation (Population) | 11.9% | 14.6% |
Similar Demographics by College, Under 1 year
Demographics Similar to Immigrants from Brazil by College, Under 1 year
In terms of college, under 1 year, the demographic groups most similar to Immigrants from Brazil are Polish (66.9%, a difference of 0.010%), Finnish (66.9%, a difference of 0.030%), Iraqi (66.8%, a difference of 0.030%), Canadian (66.8%, a difference of 0.040%), and Ugandan (66.8%, a difference of 0.050%).
| Demographics | Rating | Rank | College, Under 1 year |
| Alsatians | 91.3 /100 | #126 | Exceptional 67.1% |
| Czechs | 90.8 /100 | #127 | Exceptional 67.1% |
| Scottish | 90.2 /100 | #128 | Exceptional 67.0% |
| Immigrants | Eastern Africa | 89.5 /100 | #129 | Excellent 67.0% |
| Immigrants | Syria | 89.0 /100 | #130 | Excellent 66.9% |
| Finns | 88.6 /100 | #131 | Excellent 66.9% |
| Poles | 88.4 /100 | #132 | Excellent 66.9% |
| Immigrants | Brazil | 88.3 /100 | #133 | Excellent 66.9% |
| Iraqis | 88.0 /100 | #134 | Excellent 66.8% |
| Canadians | 87.9 /100 | #135 | Excellent 66.8% |
| Ugandans | 87.8 /100 | #136 | Excellent 66.8% |
| Immigrants | Chile | 87.4 /100 | #137 | Excellent 66.8% |
| Immigrants | Italy | 86.9 /100 | #138 | Excellent 66.8% |
| Venezuelans | 85.9 /100 | #139 | Excellent 66.7% |
| Slavs | 85.9 /100 | #140 | Excellent 66.7% |
Demographics Similar to Immigrants from Europe by College, Under 1 year
In terms of college, under 1 year, the demographic groups most similar to Immigrants from Europe are Lithuanian (68.8%, a difference of 0.010%), Bolivian (68.7%, a difference of 0.040%), Immigrants from England (68.7%, a difference of 0.080%), Swedish (68.7%, a difference of 0.14%), and Immigrants from Romania (68.9%, a difference of 0.18%).
| Demographics | Rating | Rank | College, Under 1 year |
| Northern Europeans | 99.4 /100 | #64 | Exceptional 69.0% |
| Immigrants | Moldova | 99.3 /100 | #65 | Exceptional 69.0% |
| Immigrants | North America | 99.3 /100 | #66 | Exceptional 69.0% |
| Immigrants | Zimbabwe | 99.2 /100 | #67 | Exceptional 68.9% |
| Immigrants | Indonesia | 99.2 /100 | #68 | Exceptional 68.9% |
| Immigrants | Romania | 99.2 /100 | #69 | Exceptional 68.9% |
| Lithuanians | 99.1 /100 | #70 | Exceptional 68.8% |
| Immigrants | Europe | 99.1 /100 | #71 | Exceptional 68.8% |
| Bolivians | 99.0 /100 | #72 | Exceptional 68.7% |
| Immigrants | England | 99.0 /100 | #73 | Exceptional 68.7% |
| Swedes | 98.9 /100 | #74 | Exceptional 68.7% |
| Immigrants | Western Europe | 98.6 /100 | #75 | Exceptional 68.5% |
| Laotians | 98.6 /100 | #76 | Exceptional 68.5% |
| British | 98.6 /100 | #77 | Exceptional 68.5% |
| Danes | 98.6 /100 | #78 | Exceptional 68.5% |