Bulgarian vs Chippewa Associate's Degree
COMPARE
Bulgarian
Chippewa
Associate's Degree
Associate's Degree Comparison
Bulgarians
Chippewa
53.3%
ASSOCIATE'S DEGREE
100.0/ 100
METRIC RATING
34th/ 347
METRIC RANK
40.7%
ASSOCIATE'S DEGREE
0.2/ 100
METRIC RATING
270th/ 347
METRIC RANK
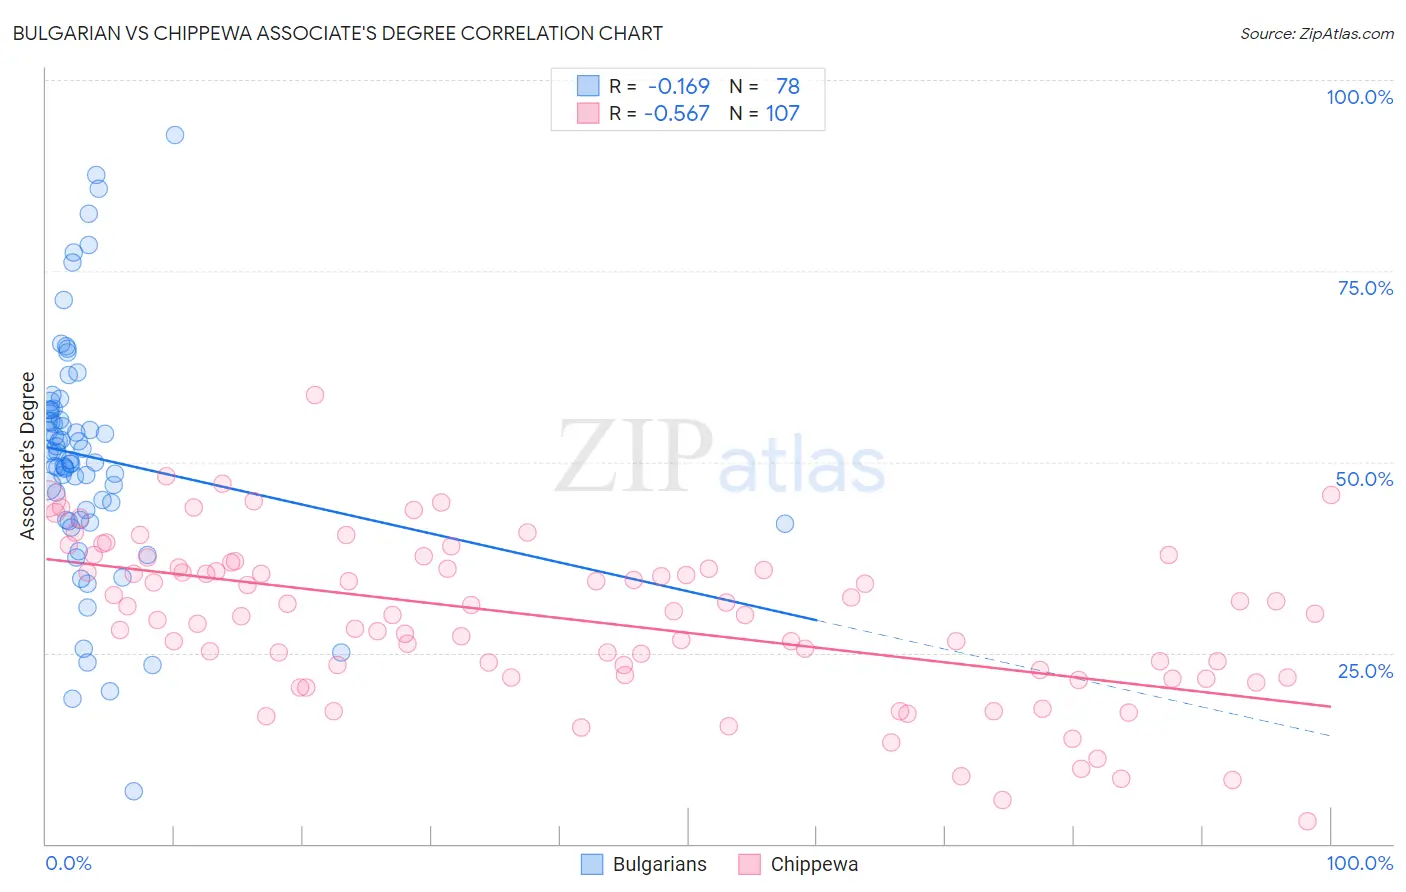
Bulgarian vs Chippewa Associate's Degree Correlation Chart
The statistical analysis conducted on geographies consisting of 205,619,803 people shows a poor negative correlation between the proportion of Bulgarians and percentage of population with at least associate's degree education in the United States with a correlation coefficient (R) of -0.169 and weighted average of 53.3%. Similarly, the statistical analysis conducted on geographies consisting of 215,061,498 people shows a substantial negative correlation between the proportion of Chippewa and percentage of population with at least associate's degree education in the United States with a correlation coefficient (R) of -0.567 and weighted average of 40.7%, a difference of 30.8%.
Associate's Degree Correlation Summary
| Measurement | Bulgarian | Chippewa |
| Minimum | 6.9% | 2.9% |
| Maximum | 92.7% | 58.7% |
| Range | 85.9% | 55.8% |
| Mean | 50.7% | 29.5% |
| Median | 50.7% | 30.2% |
| Interquartile 25% (IQ1) | 42.4% | 22.1% |
| Interquartile 75% (IQ3) | 56.8% | 36.2% |
| Interquartile Range (IQR) | 14.4% | 14.1% |
| Standard Deviation (Sample) | 15.5% | 10.5% |
| Standard Deviation (Population) | 15.4% | 10.4% |
Similar Demographics by Associate's Degree
Demographics Similar to Bulgarians by Associate's Degree
In terms of associate's degree, the demographic groups most similar to Bulgarians are Russian (53.2%, a difference of 0.060%), Israeli (53.4%, a difference of 0.19%), Immigrants from Turkey (53.4%, a difference of 0.31%), Immigrants from Northern Europe (53.5%, a difference of 0.34%), and Immigrants from Russia (53.1%, a difference of 0.35%).
| Demographics | Rating | Rank | Associate's Degree |
| Latvians | 100.0 /100 | #27 | Exceptional 53.9% |
| Turks | 100.0 /100 | #28 | Exceptional 53.9% |
| Immigrants | France | 100.0 /100 | #29 | Exceptional 53.9% |
| Immigrants | Sri Lanka | 100.0 /100 | #30 | Exceptional 53.7% |
| Immigrants | Northern Europe | 100.0 /100 | #31 | Exceptional 53.5% |
| Immigrants | Turkey | 100.0 /100 | #32 | Exceptional 53.4% |
| Israelis | 100.0 /100 | #33 | Exceptional 53.4% |
| Bulgarians | 100.0 /100 | #34 | Exceptional 53.3% |
| Russians | 100.0 /100 | #35 | Exceptional 53.2% |
| Immigrants | Russia | 100.0 /100 | #36 | Exceptional 53.1% |
| Immigrants | Denmark | 100.0 /100 | #37 | Exceptional 53.1% |
| Mongolians | 100.0 /100 | #38 | Exceptional 53.0% |
| Immigrants | Belarus | 99.9 /100 | #39 | Exceptional 52.8% |
| Immigrants | Latvia | 99.9 /100 | #40 | Exceptional 52.8% |
| Immigrants | Saudi Arabia | 99.9 /100 | #41 | Exceptional 52.6% |
Demographics Similar to Chippewa by Associate's Degree
In terms of associate's degree, the demographic groups most similar to Chippewa are American (40.8%, a difference of 0.050%), Immigrants from Laos (40.7%, a difference of 0.18%), Central American Indian (40.8%, a difference of 0.23%), Belizean (40.6%, a difference of 0.25%), and Hawaiian (40.9%, a difference of 0.42%).
| Demographics | Rating | Rank | Associate's Degree |
| Immigrants | Jamaica | 0.3 /100 | #263 | Tragic 41.5% |
| Osage | 0.3 /100 | #264 | Tragic 41.5% |
| Africans | 0.2 /100 | #265 | Tragic 41.1% |
| Samoans | 0.2 /100 | #266 | Tragic 41.1% |
| Hawaiians | 0.2 /100 | #267 | Tragic 40.9% |
| Central American Indians | 0.2 /100 | #268 | Tragic 40.8% |
| Americans | 0.2 /100 | #269 | Tragic 40.8% |
| Chippewa | 0.2 /100 | #270 | Tragic 40.7% |
| Immigrants | Laos | 0.1 /100 | #271 | Tragic 40.7% |
| Belizeans | 0.1 /100 | #272 | Tragic 40.6% |
| Puget Sound Salish | 0.1 /100 | #273 | Tragic 40.5% |
| Immigrants | Dominica | 0.1 /100 | #274 | Tragic 40.5% |
| Potawatomi | 0.1 /100 | #275 | Tragic 40.4% |
| Puerto Ricans | 0.1 /100 | #276 | Tragic 40.4% |
| Blackfeet | 0.1 /100 | #277 | Tragic 40.3% |