Bulgarian vs Immigrants from Africa Disability Age 18 to 34
COMPARE
Bulgarian
Immigrants from Africa
Disability Age 18 to 34
Disability Age 18 to 34 Comparison
Bulgarians
Immigrants from Africa
6.5%
DISABILITY AGE 18 TO 34
78.3/ 100
METRIC RATING
152nd/ 347
METRIC RANK
6.6%
DISABILITY AGE 18 TO 34
45.9/ 100
METRIC RATING
176th/ 347
METRIC RANK
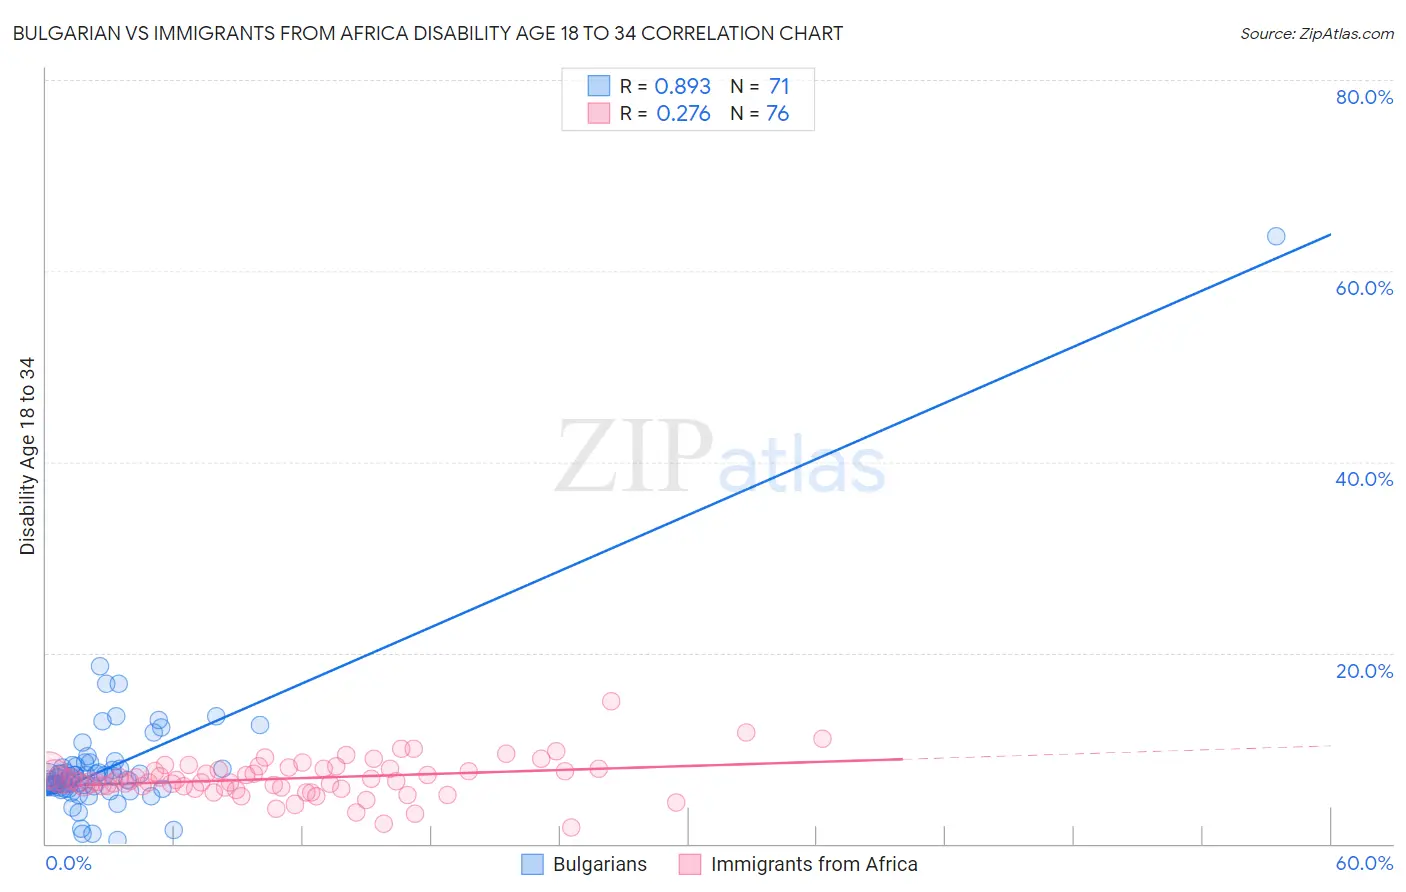
Bulgarian vs Immigrants from Africa Disability Age 18 to 34 Correlation Chart
The statistical analysis conducted on geographies consisting of 205,383,127 people shows a very strong positive correlation between the proportion of Bulgarians and percentage of population with a disability between the ages 18 and 35 in the United States with a correlation coefficient (R) of 0.893 and weighted average of 6.5%. Similarly, the statistical analysis conducted on geographies consisting of 468,122,766 people shows a weak positive correlation between the proportion of Immigrants from Africa and percentage of population with a disability between the ages 18 and 35 in the United States with a correlation coefficient (R) of 0.276 and weighted average of 6.6%, a difference of 2.6%.
Disability Age 18 to 34 Correlation Summary
| Measurement | Bulgarian | Immigrants from Africa |
| Minimum | 0.34% | 1.7% |
| Maximum | 63.6% | 14.9% |
| Range | 63.3% | 13.2% |
| Mean | 8.1% | 6.8% |
| Median | 6.7% | 6.5% |
| Interquartile 25% (IQ1) | 5.8% | 5.9% |
| Interquartile 75% (IQ3) | 8.1% | 7.8% |
| Interquartile Range (IQR) | 2.3% | 1.9% |
| Standard Deviation (Sample) | 7.5% | 2.0% |
| Standard Deviation (Population) | 7.5% | 2.0% |
Similar Demographics by Disability Age 18 to 34
Demographics Similar to Bulgarians by Disability Age 18 to 34
In terms of disability age 18 to 34, the demographic groups most similar to Bulgarians are Immigrants from Eritrea (6.5%, a difference of 0.090%), Immigrants from Central America (6.5%, a difference of 0.16%), Inupiat (6.5%, a difference of 0.16%), Immigrants from Panama (6.5%, a difference of 0.29%), and Immigrants from Sierra Leone (6.5%, a difference of 0.32%).
| Demographics | Rating | Rank | Disability Age 18 to 34 |
| Moroccans | 85.2 /100 | #145 | Excellent 6.4% |
| Belizeans | 84.9 /100 | #146 | Excellent 6.4% |
| Immigrants | South Africa | 83.7 /100 | #147 | Excellent 6.4% |
| Immigrants | Belgium | 83.5 /100 | #148 | Excellent 6.4% |
| Hondurans | 83.1 /100 | #149 | Excellent 6.4% |
| Immigrants | Dominican Republic | 82.7 /100 | #150 | Excellent 6.4% |
| Tongans | 81.9 /100 | #151 | Excellent 6.4% |
| Bulgarians | 78.3 /100 | #152 | Good 6.5% |
| Immigrants | Eritrea | 77.4 /100 | #153 | Good 6.5% |
| Immigrants | Central America | 76.8 /100 | #154 | Good 6.5% |
| Inupiat | 76.7 /100 | #155 | Good 6.5% |
| Immigrants | Panama | 75.3 /100 | #156 | Good 6.5% |
| Immigrants | Sierra Leone | 75.0 /100 | #157 | Good 6.5% |
| Zimbabweans | 74.7 /100 | #158 | Good 6.5% |
| Dominicans | 73.6 /100 | #159 | Good 6.5% |
Demographics Similar to Immigrants from Africa by Disability Age 18 to 34
In terms of disability age 18 to 34, the demographic groups most similar to Immigrants from Africa are Immigrants from Cambodia (6.6%, a difference of 0.040%), Syrian (6.6%, a difference of 0.11%), Nigerian (6.6%, a difference of 0.15%), Immigrants from Ghana (6.6%, a difference of 0.26%), and Native Hawaiian (6.6%, a difference of 0.29%).
| Demographics | Rating | Rank | Disability Age 18 to 34 |
| Russians | 60.2 /100 | #169 | Good 6.5% |
| Immigrants | Bahamas | 57.9 /100 | #170 | Average 6.6% |
| Bahamians | 55.5 /100 | #171 | Average 6.6% |
| Ghanaians | 54.7 /100 | #172 | Average 6.6% |
| Immigrants | Mexico | 54.1 /100 | #173 | Average 6.6% |
| Native Hawaiians | 50.0 /100 | #174 | Average 6.6% |
| Immigrants | Cambodia | 46.5 /100 | #175 | Average 6.6% |
| Immigrants | Africa | 45.9 /100 | #176 | Average 6.6% |
| Syrians | 44.3 /100 | #177 | Average 6.6% |
| Nigerians | 43.7 /100 | #178 | Average 6.6% |
| Immigrants | Ghana | 42.1 /100 | #179 | Average 6.6% |
| Immigrants | Austria | 39.6 /100 | #180 | Fair 6.6% |
| Romanians | 39.5 /100 | #181 | Fair 6.6% |
| U.S. Virgin Islanders | 38.6 /100 | #182 | Fair 6.7% |
| Immigrants | Iraq | 37.4 /100 | #183 | Fair 6.7% |