Somali vs Chippewa Associate's Degree
COMPARE
Somali
Chippewa
Associate's Degree
Associate's Degree Comparison
Somalis
Chippewa
46.8%
ASSOCIATE'S DEGREE
62.5/ 100
METRIC RATING
163rd/ 347
METRIC RANK
40.7%
ASSOCIATE'S DEGREE
0.2/ 100
METRIC RATING
270th/ 347
METRIC RANK
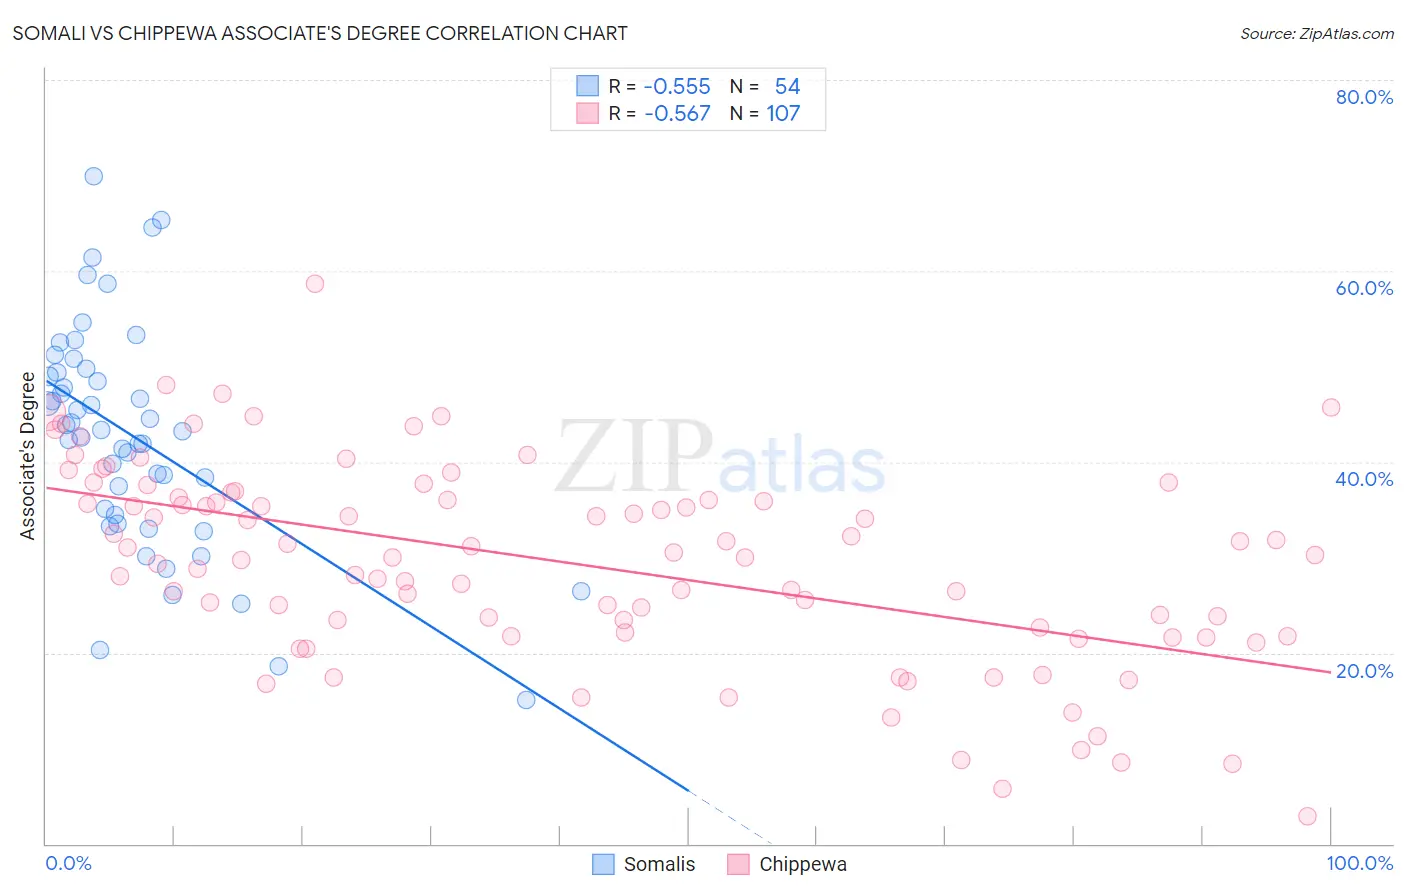
Somali vs Chippewa Associate's Degree Correlation Chart
The statistical analysis conducted on geographies consisting of 99,330,256 people shows a substantial negative correlation between the proportion of Somalis and percentage of population with at least associate's degree education in the United States with a correlation coefficient (R) of -0.555 and weighted average of 46.8%. Similarly, the statistical analysis conducted on geographies consisting of 215,061,498 people shows a substantial negative correlation between the proportion of Chippewa and percentage of population with at least associate's degree education in the United States with a correlation coefficient (R) of -0.567 and weighted average of 40.7%, a difference of 14.9%.
Associate's Degree Correlation Summary
| Measurement | Somali | Chippewa |
| Minimum | 15.0% | 2.9% |
| Maximum | 69.9% | 58.7% |
| Range | 54.9% | 55.8% |
| Mean | 42.6% | 29.5% |
| Median | 43.3% | 30.2% |
| Interquartile 25% (IQ1) | 34.4% | 22.1% |
| Interquartile 75% (IQ3) | 49.4% | 36.2% |
| Interquartile Range (IQR) | 15.0% | 14.1% |
| Standard Deviation (Sample) | 11.7% | 10.5% |
| Standard Deviation (Population) | 11.6% | 10.4% |
Similar Demographics by Associate's Degree
Demographics Similar to Somalis by Associate's Degree
In terms of associate's degree, the demographic groups most similar to Somalis are Colombian (46.8%, a difference of 0.010%), Immigrants from Africa (46.8%, a difference of 0.060%), Immigrants from South America (46.7%, a difference of 0.21%), Scandinavian (46.9%, a difference of 0.22%), and Scottish (46.9%, a difference of 0.23%).
| Demographics | Rating | Rank | Associate's Degree |
| South Americans | 70.5 /100 | #156 | Good 47.1% |
| Sudanese | 70.3 /100 | #157 | Good 47.1% |
| Immigrants | Germany | 69.7 /100 | #158 | Good 47.1% |
| Immigrants | Poland | 69.2 /100 | #159 | Good 47.1% |
| Scottish | 65.4 /100 | #160 | Good 46.9% |
| Scandinavians | 65.2 /100 | #161 | Good 46.9% |
| Immigrants | Africa | 63.2 /100 | #162 | Good 46.8% |
| Somalis | 62.5 /100 | #163 | Good 46.8% |
| Colombians | 62.4 /100 | #164 | Good 46.8% |
| Immigrants | South America | 59.9 /100 | #165 | Average 46.7% |
| Hungarians | 59.3 /100 | #166 | Average 46.7% |
| Immigrants | Sierra Leone | 59.2 /100 | #167 | Average 46.7% |
| Immigrants | Somalia | 55.5 /100 | #168 | Average 46.5% |
| Uruguayans | 55.4 /100 | #169 | Average 46.5% |
| Irish | 53.6 /100 | #170 | Average 46.5% |
Demographics Similar to Chippewa by Associate's Degree
In terms of associate's degree, the demographic groups most similar to Chippewa are American (40.8%, a difference of 0.050%), Immigrants from Laos (40.7%, a difference of 0.18%), Central American Indian (40.8%, a difference of 0.23%), Belizean (40.6%, a difference of 0.25%), and Hawaiian (40.9%, a difference of 0.42%).
| Demographics | Rating | Rank | Associate's Degree |
| Immigrants | Jamaica | 0.3 /100 | #263 | Tragic 41.5% |
| Osage | 0.3 /100 | #264 | Tragic 41.5% |
| Africans | 0.2 /100 | #265 | Tragic 41.1% |
| Samoans | 0.2 /100 | #266 | Tragic 41.1% |
| Hawaiians | 0.2 /100 | #267 | Tragic 40.9% |
| Central American Indians | 0.2 /100 | #268 | Tragic 40.8% |
| Americans | 0.2 /100 | #269 | Tragic 40.8% |
| Chippewa | 0.2 /100 | #270 | Tragic 40.7% |
| Immigrants | Laos | 0.1 /100 | #271 | Tragic 40.7% |
| Belizeans | 0.1 /100 | #272 | Tragic 40.6% |
| Puget Sound Salish | 0.1 /100 | #273 | Tragic 40.5% |
| Immigrants | Dominica | 0.1 /100 | #274 | Tragic 40.5% |
| Potawatomi | 0.1 /100 | #275 | Tragic 40.4% |
| Puerto Ricans | 0.1 /100 | #276 | Tragic 40.4% |
| Blackfeet | 0.1 /100 | #277 | Tragic 40.3% |