Immigrants from Honduras vs Jordanian College, 1 year or more
COMPARE
Immigrants from Honduras
Jordanian
College, 1 year or more
College, 1 year or more Comparison
Immigrants from Honduras
Jordanians
51.0%
COLLEGE, 1 YEAR OR MORE
0.0/ 100
METRIC RATING
318th/ 347
METRIC RANK
62.2%
COLLEGE, 1 YEAR OR MORE
97.2/ 100
METRIC RATING
97th/ 347
METRIC RANK
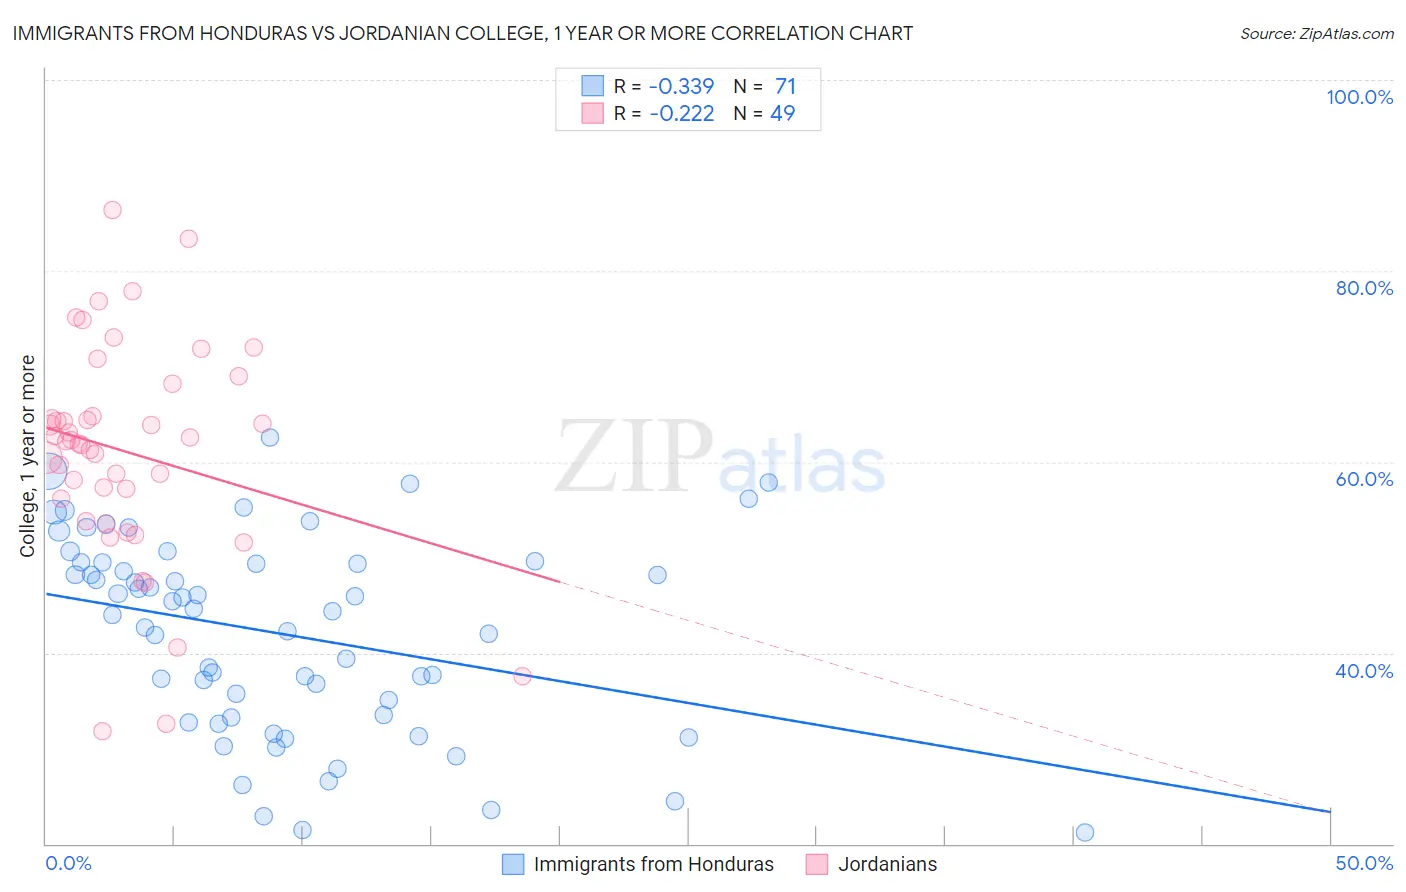
Immigrants from Honduras vs Jordanian College, 1 year or more Correlation Chart
The statistical analysis conducted on geographies consisting of 322,637,082 people shows a mild negative correlation between the proportion of Immigrants from Honduras and percentage of population with at least college, 1 year or more education in the United States with a correlation coefficient (R) of -0.339 and weighted average of 51.0%. Similarly, the statistical analysis conducted on geographies consisting of 166,424,117 people shows a weak negative correlation between the proportion of Jordanians and percentage of population with at least college, 1 year or more education in the United States with a correlation coefficient (R) of -0.222 and weighted average of 62.2%, a difference of 21.8%.
College, 1 year or more Correlation Summary
| Measurement | Immigrants from Honduras | Jordanian |
| Minimum | 21.2% | 31.8% |
| Maximum | 62.6% | 86.4% |
| Range | 41.4% | 54.6% |
| Mean | 42.0% | 61.0% |
| Median | 44.4% | 62.1% |
| Interquartile 25% (IQ1) | 33.2% | 55.0% |
| Interquartile 75% (IQ3) | 49.4% | 66.5% |
| Interquartile Range (IQR) | 16.3% | 11.5% |
| Standard Deviation (Sample) | 10.3% | 11.4% |
| Standard Deviation (Population) | 10.2% | 11.3% |
Similar Demographics by College, 1 year or more
Demographics Similar to Immigrants from Honduras by College, 1 year or more
In terms of college, 1 year or more, the demographic groups most similar to Immigrants from Honduras are Immigrants from El Salvador (51.0%, a difference of 0.090%), Hispanic or Latino (51.1%, a difference of 0.13%), Kiowa (51.0%, a difference of 0.15%), Cajun (51.2%, a difference of 0.22%), and Hopi (50.9%, a difference of 0.27%).
| Demographics | Rating | Rank | College, 1 year or more |
| Immigrants | Haiti | 0.0 /100 | #311 | Tragic 51.5% |
| Pueblo | 0.0 /100 | #312 | Tragic 51.5% |
| Immigrants | Caribbean | 0.0 /100 | #313 | Tragic 51.4% |
| Fijians | 0.0 /100 | #314 | Tragic 51.3% |
| Guatemalans | 0.0 /100 | #315 | Tragic 51.2% |
| Cajuns | 0.0 /100 | #316 | Tragic 51.2% |
| Hispanics or Latinos | 0.0 /100 | #317 | Tragic 51.1% |
| Immigrants | Honduras | 0.0 /100 | #318 | Tragic 51.0% |
| Immigrants | El Salvador | 0.0 /100 | #319 | Tragic 51.0% |
| Kiowa | 0.0 /100 | #320 | Tragic 51.0% |
| Hopi | 0.0 /100 | #321 | Tragic 50.9% |
| Navajo | 0.0 /100 | #322 | Tragic 50.8% |
| Immigrants | Guatemala | 0.0 /100 | #323 | Tragic 50.7% |
| Immigrants | Cuba | 0.0 /100 | #324 | Tragic 50.7% |
| Immigrants | Latin America | 0.0 /100 | #325 | Tragic 50.7% |
Demographics Similar to Jordanians by College, 1 year or more
In terms of college, 1 year or more, the demographic groups most similar to Jordanians are Carpatho Rusyn (62.2%, a difference of 0.0%), Chinese (62.2%, a difference of 0.010%), Croatian (62.2%, a difference of 0.010%), British (62.3%, a difference of 0.12%), and Icelander (62.1%, a difference of 0.17%).
| Demographics | Rating | Rank | College, 1 year or more |
| Immigrants | Western Asia | 97.9 /100 | #90 | Exceptional 62.5% |
| Immigrants | Eastern Europe | 97.8 /100 | #91 | Exceptional 62.4% |
| Immigrants | Egypt | 97.8 /100 | #92 | Exceptional 62.4% |
| Romanians | 97.7 /100 | #93 | Exceptional 62.4% |
| Immigrants | Croatia | 97.6 /100 | #94 | Exceptional 62.3% |
| British | 97.4 /100 | #95 | Exceptional 62.3% |
| Chinese | 97.2 /100 | #96 | Exceptional 62.2% |
| Jordanians | 97.2 /100 | #97 | Exceptional 62.2% |
| Carpatho Rusyns | 97.2 /100 | #98 | Exceptional 62.2% |
| Croatians | 97.1 /100 | #99 | Exceptional 62.2% |
| Icelanders | 96.8 /100 | #100 | Exceptional 62.1% |
| Swedes | 96.8 /100 | #101 | Exceptional 62.1% |
| Luxembourgers | 96.7 /100 | #102 | Exceptional 62.1% |
| Afghans | 96.4 /100 | #103 | Exceptional 62.0% |
| Chileans | 96.4 /100 | #104 | Exceptional 62.0% |