Immigrants from Nepal vs Potawatomi Doctorate Degree
COMPARE
Immigrants from Nepal
Potawatomi
Doctorate Degree
Doctorate Degree Comparison
Immigrants from Nepal
Potawatomi
2.2%
DOCTORATE DEGREE
99.3/ 100
METRIC RATING
88th/ 347
METRIC RANK
1.6%
DOCTORATE DEGREE
1.6/ 100
METRIC RATING
249th/ 347
METRIC RANK
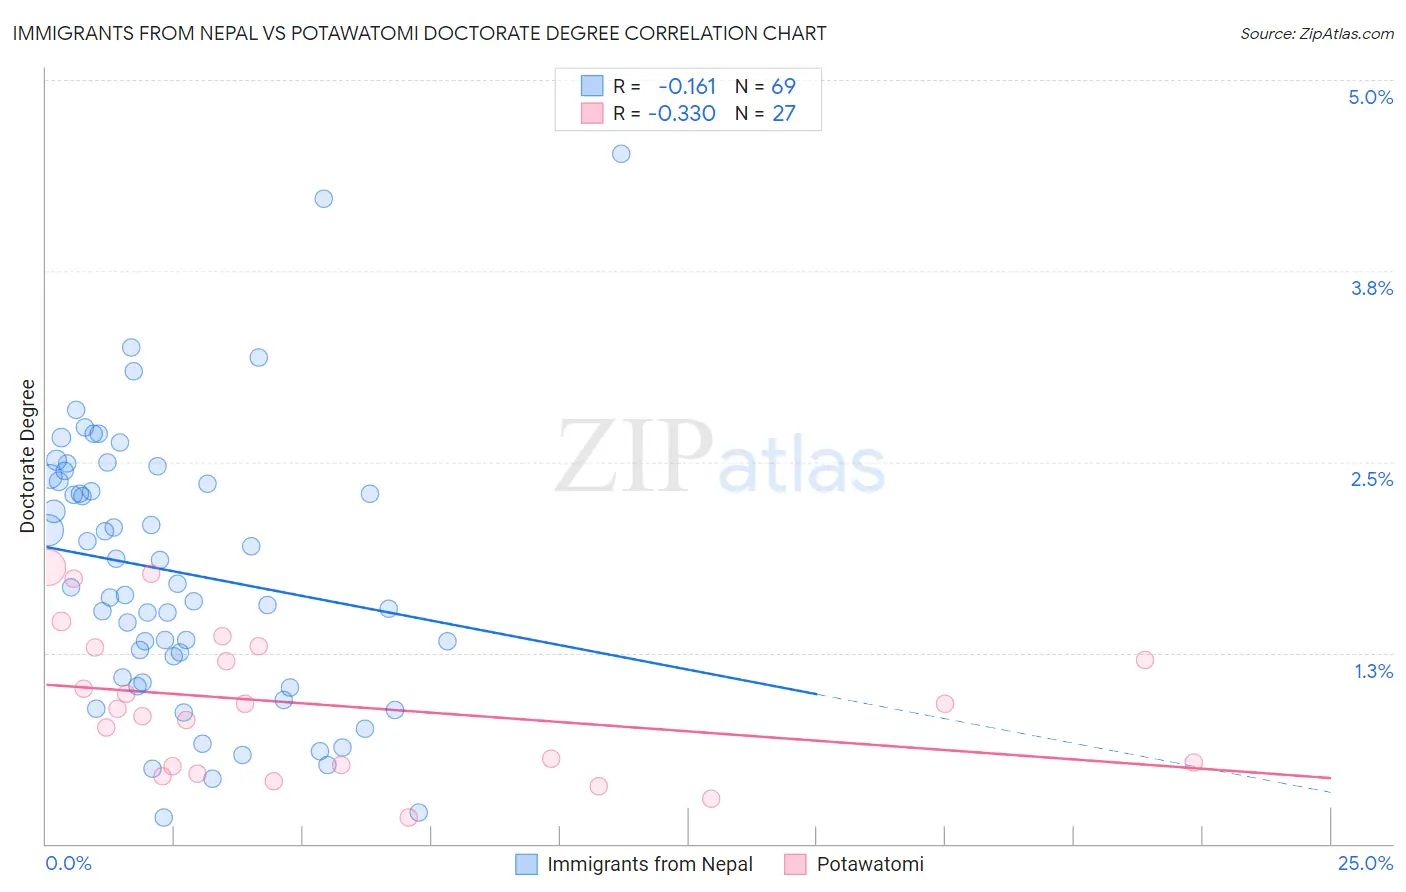
Immigrants from Nepal vs Potawatomi Doctorate Degree Correlation Chart
The statistical analysis conducted on geographies consisting of 186,268,809 people shows a poor negative correlation between the proportion of Immigrants from Nepal and percentage of population with at least doctorate degree education in the United States with a correlation coefficient (R) of -0.161 and weighted average of 2.2%. Similarly, the statistical analysis conducted on geographies consisting of 116,746,073 people shows a mild negative correlation between the proportion of Potawatomi and percentage of population with at least doctorate degree education in the United States with a correlation coefficient (R) of -0.330 and weighted average of 1.6%, a difference of 39.5%.
Doctorate Degree Correlation Summary
| Measurement | Immigrants from Nepal | Potawatomi |
| Minimum | 0.17% | 0.18% |
| Maximum | 4.5% | 1.8% |
| Range | 4.3% | 1.6% |
| Mean | 1.8% | 0.91% |
| Median | 1.7% | 0.88% |
| Interquartile 25% (IQ1) | 1.1% | 0.51% |
| Interquartile 75% (IQ3) | 2.4% | 1.3% |
| Interquartile Range (IQR) | 1.3% | 0.78% |
| Standard Deviation (Sample) | 0.89% | 0.47% |
| Standard Deviation (Population) | 0.88% | 0.46% |
Similar Demographics by Doctorate Degree
Demographics Similar to Immigrants from Nepal by Doctorate Degree
In terms of doctorate degree, the demographic groups most similar to Immigrants from Nepal are Immigrants from Zimbabwe (2.2%, a difference of 0.36%), British (2.2%, a difference of 0.44%), Immigrants from Scotland (2.2%, a difference of 0.45%), Egyptian (2.2%, a difference of 0.47%), and Immigrants from Sudan (2.2%, a difference of 0.93%).
| Demographics | Rating | Rank | Doctorate Degree |
| Immigrants | Argentina | 99.7 /100 | #81 | Exceptional 2.2% |
| Immigrants | Uganda | 99.6 /100 | #82 | Exceptional 2.2% |
| Immigrants | Lithuania | 99.6 /100 | #83 | Exceptional 2.2% |
| Immigrants | England | 99.6 /100 | #84 | Exceptional 2.2% |
| Immigrants | Brazil | 99.6 /100 | #85 | Exceptional 2.2% |
| Egyptians | 99.4 /100 | #86 | Exceptional 2.2% |
| Immigrants | Zimbabwe | 99.4 /100 | #87 | Exceptional 2.2% |
| Immigrants | Nepal | 99.3 /100 | #88 | Exceptional 2.2% |
| British | 99.3 /100 | #89 | Exceptional 2.2% |
| Immigrants | Scotland | 99.2 /100 | #90 | Exceptional 2.2% |
| Immigrants | Sudan | 99.1 /100 | #91 | Exceptional 2.2% |
| Chileans | 99.1 /100 | #92 | Exceptional 2.2% |
| Alsatians | 99.0 /100 | #93 | Exceptional 2.1% |
| Greeks | 98.8 /100 | #94 | Exceptional 2.1% |
| Immigrants | Romania | 98.7 /100 | #95 | Exceptional 2.1% |
Demographics Similar to Potawatomi by Doctorate Degree
In terms of doctorate degree, the demographic groups most similar to Potawatomi are Immigrants from Fiji (1.6%, a difference of 0.030%), African (1.6%, a difference of 0.47%), Comanche (1.6%, a difference of 0.59%), Hmong (1.6%, a difference of 0.61%), and Delaware (1.6%, a difference of 0.70%).
| Demographics | Rating | Rank | Doctorate Degree |
| Ottawa | 2.2 /100 | #242 | Tragic 1.6% |
| Native Hawaiians | 2.1 /100 | #243 | Tragic 1.6% |
| French American Indians | 2.0 /100 | #244 | Tragic 1.6% |
| Delaware | 1.9 /100 | #245 | Tragic 1.6% |
| Hmong | 1.8 /100 | #246 | Tragic 1.6% |
| Comanche | 1.8 /100 | #247 | Tragic 1.6% |
| Africans | 1.8 /100 | #248 | Tragic 1.6% |
| Potawatomi | 1.6 /100 | #249 | Tragic 1.6% |
| Immigrants | Fiji | 1.6 /100 | #250 | Tragic 1.6% |
| Apache | 1.3 /100 | #251 | Tragic 1.5% |
| Yuman | 1.1 /100 | #252 | Tragic 1.5% |
| Americans | 1.0 /100 | #253 | Tragic 1.5% |
| Immigrants | Cambodia | 1.0 /100 | #254 | Tragic 1.5% |
| Trinidadians and Tobagonians | 1.0 /100 | #255 | Tragic 1.5% |
| Central American Indians | 1.0 /100 | #256 | Tragic 1.5% |