Armenian vs Potawatomi Doctorate Degree
COMPARE
Armenian
Potawatomi
Doctorate Degree
Doctorate Degree Comparison
Armenians
Potawatomi
2.1%
DOCTORATE DEGREE
98.3/ 100
METRIC RATING
98th/ 347
METRIC RANK
1.6%
DOCTORATE DEGREE
1.6/ 100
METRIC RATING
249th/ 347
METRIC RANK
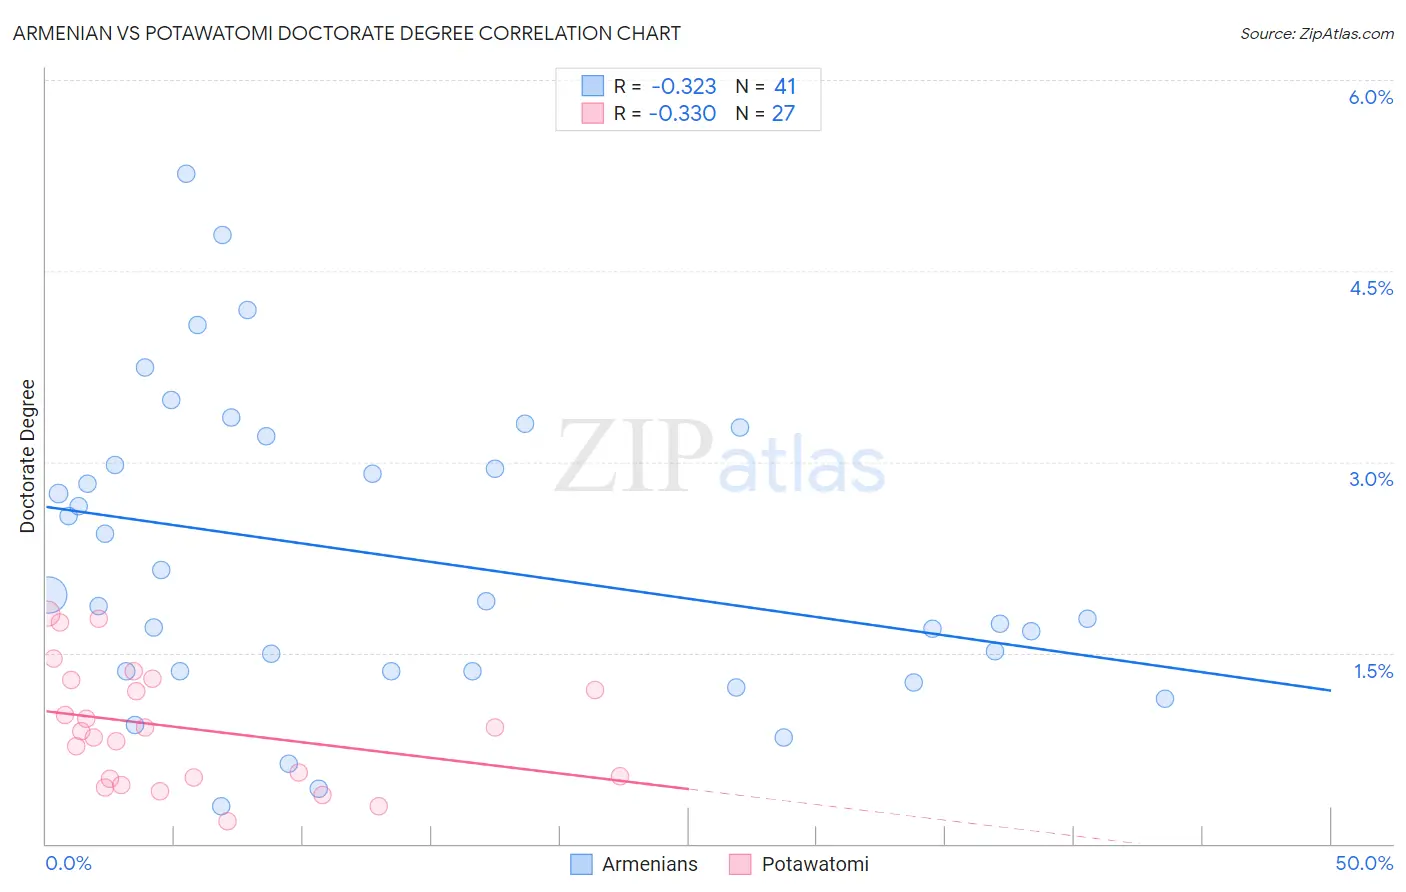
Armenian vs Potawatomi Doctorate Degree Correlation Chart
The statistical analysis conducted on geographies consisting of 309,311,130 people shows a mild negative correlation between the proportion of Armenians and percentage of population with at least doctorate degree education in the United States with a correlation coefficient (R) of -0.323 and weighted average of 2.1%. Similarly, the statistical analysis conducted on geographies consisting of 116,746,073 people shows a mild negative correlation between the proportion of Potawatomi and percentage of population with at least doctorate degree education in the United States with a correlation coefficient (R) of -0.330 and weighted average of 1.6%, a difference of 35.4%.
Doctorate Degree Correlation Summary
| Measurement | Armenian | Potawatomi |
| Minimum | 0.29% | 0.18% |
| Maximum | 5.3% | 1.8% |
| Range | 5.0% | 1.6% |
| Mean | 2.3% | 0.91% |
| Median | 1.9% | 0.88% |
| Interquartile 25% (IQ1) | 1.4% | 0.51% |
| Interquartile 75% (IQ3) | 3.1% | 1.3% |
| Interquartile Range (IQR) | 1.7% | 0.78% |
| Standard Deviation (Sample) | 1.2% | 0.47% |
| Standard Deviation (Population) | 1.2% | 0.46% |
Similar Demographics by Doctorate Degree
Demographics Similar to Armenians by Doctorate Degree
In terms of doctorate degree, the demographic groups most similar to Armenians are Immigrants from Eritrea (2.1%, a difference of 0.080%), Immigrants from Egypt (2.1%, a difference of 0.18%), Immigrants from Eastern Europe (2.1%, a difference of 0.18%), Immigrants from Northern Africa (2.1%, a difference of 0.21%), and Immigrants from Eastern Africa (2.1%, a difference of 0.21%).
| Demographics | Rating | Rank | Doctorate Degree |
| Immigrants | Sudan | 99.1 /100 | #91 | Exceptional 2.2% |
| Chileans | 99.1 /100 | #92 | Exceptional 2.2% |
| Alsatians | 99.0 /100 | #93 | Exceptional 2.1% |
| Greeks | 98.8 /100 | #94 | Exceptional 2.1% |
| Immigrants | Romania | 98.7 /100 | #95 | Exceptional 2.1% |
| Immigrants | Northern Africa | 98.4 /100 | #96 | Exceptional 2.1% |
| Immigrants | Eritrea | 98.4 /100 | #97 | Exceptional 2.1% |
| Armenians | 98.3 /100 | #98 | Exceptional 2.1% |
| Immigrants | Egypt | 98.2 /100 | #99 | Exceptional 2.1% |
| Immigrants | Eastern Europe | 98.2 /100 | #100 | Exceptional 2.1% |
| Immigrants | Eastern Africa | 98.2 /100 | #101 | Exceptional 2.1% |
| Immigrants | Chile | 98.1 /100 | #102 | Exceptional 2.1% |
| Romanians | 98.1 /100 | #103 | Exceptional 2.1% |
| Austrians | 98.0 /100 | #104 | Exceptional 2.1% |
| Arabs | 97.8 /100 | #105 | Exceptional 2.1% |
Demographics Similar to Potawatomi by Doctorate Degree
In terms of doctorate degree, the demographic groups most similar to Potawatomi are Immigrants from Fiji (1.6%, a difference of 0.030%), African (1.6%, a difference of 0.47%), Comanche (1.6%, a difference of 0.59%), Hmong (1.6%, a difference of 0.61%), and Delaware (1.6%, a difference of 0.70%).
| Demographics | Rating | Rank | Doctorate Degree |
| Ottawa | 2.2 /100 | #242 | Tragic 1.6% |
| Native Hawaiians | 2.1 /100 | #243 | Tragic 1.6% |
| French American Indians | 2.0 /100 | #244 | Tragic 1.6% |
| Delaware | 1.9 /100 | #245 | Tragic 1.6% |
| Hmong | 1.8 /100 | #246 | Tragic 1.6% |
| Comanche | 1.8 /100 | #247 | Tragic 1.6% |
| Africans | 1.8 /100 | #248 | Tragic 1.6% |
| Potawatomi | 1.6 /100 | #249 | Tragic 1.6% |
| Immigrants | Fiji | 1.6 /100 | #250 | Tragic 1.6% |
| Apache | 1.3 /100 | #251 | Tragic 1.5% |
| Yuman | 1.1 /100 | #252 | Tragic 1.5% |
| Americans | 1.0 /100 | #253 | Tragic 1.5% |
| Immigrants | Cambodia | 1.0 /100 | #254 | Tragic 1.5% |
| Trinidadians and Tobagonians | 1.0 /100 | #255 | Tragic 1.5% |
| Central American Indians | 1.0 /100 | #256 | Tragic 1.5% |