Immigrants from Syria vs Guatemalan Doctorate Degree
COMPARE
Immigrants from Syria
Guatemalan
Doctorate Degree
Doctorate Degree Comparison
Immigrants from Syria
Guatemalans
1.9%
DOCTORATE DEGREE
83.6/ 100
METRIC RATING
146th/ 347
METRIC RANK
1.4%
DOCTORATE DEGREE
0.2/ 100
METRIC RATING
295th/ 347
METRIC RANK
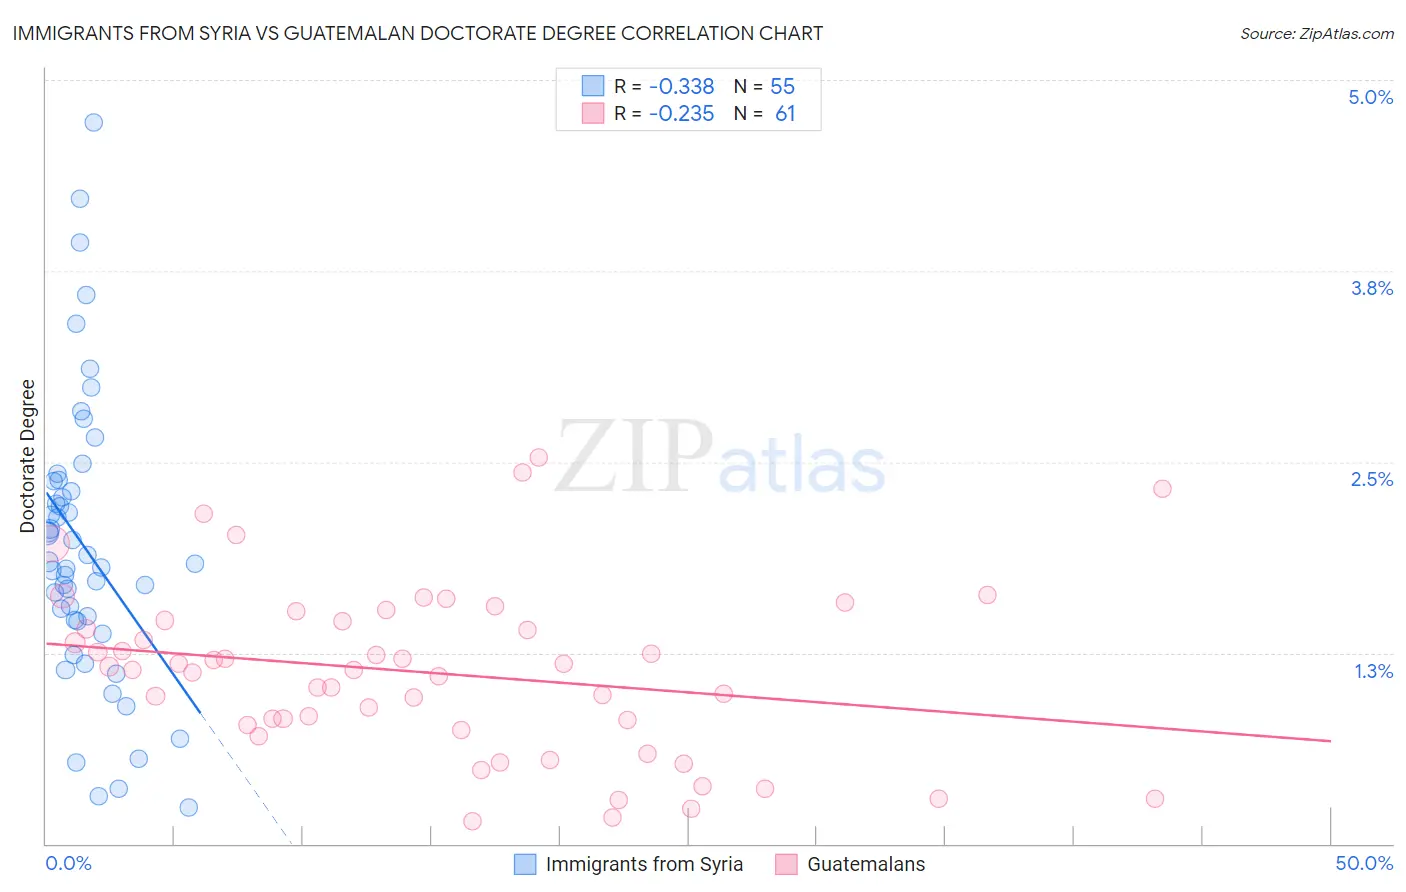
Immigrants from Syria vs Guatemalan Doctorate Degree Correlation Chart
The statistical analysis conducted on geographies consisting of 173,800,904 people shows a mild negative correlation between the proportion of Immigrants from Syria and percentage of population with at least doctorate degree education in the United States with a correlation coefficient (R) of -0.338 and weighted average of 1.9%. Similarly, the statistical analysis conducted on geographies consisting of 404,030,982 people shows a weak negative correlation between the proportion of Guatemalans and percentage of population with at least doctorate degree education in the United States with a correlation coefficient (R) of -0.235 and weighted average of 1.4%, a difference of 38.0%.
Doctorate Degree Correlation Summary
| Measurement | Immigrants from Syria | Guatemalan |
| Minimum | 0.24% | 0.15% |
| Maximum | 4.7% | 2.5% |
| Range | 4.5% | 2.4% |
| Mean | 1.9% | 1.1% |
| Median | 1.8% | 1.1% |
| Interquartile 25% (IQ1) | 1.5% | 0.76% |
| Interquartile 75% (IQ3) | 2.4% | 1.5% |
| Interquartile Range (IQR) | 0.92% | 0.70% |
| Standard Deviation (Sample) | 0.94% | 0.56% |
| Standard Deviation (Population) | 0.93% | 0.55% |
Similar Demographics by Doctorate Degree
Demographics Similar to Immigrants from Syria by Doctorate Degree
In terms of doctorate degree, the demographic groups most similar to Immigrants from Syria are Kenyan (1.9%, a difference of 0.020%), Immigrants from Moldova (2.0%, a difference of 0.20%), Immigrants from Senegal (1.9%, a difference of 0.25%), Sierra Leonean (2.0%, a difference of 0.41%), and Luxembourger (1.9%, a difference of 0.58%).
| Demographics | Rating | Rank | Doctorate Degree |
| Afghans | 87.2 /100 | #139 | Excellent 2.0% |
| Immigrants | Africa | 87.0 /100 | #140 | Excellent 2.0% |
| Senegalese | 86.7 /100 | #141 | Excellent 2.0% |
| Italians | 86.0 /100 | #142 | Excellent 2.0% |
| Sierra Leoneans | 85.1 /100 | #143 | Excellent 2.0% |
| Immigrants | Moldova | 84.3 /100 | #144 | Excellent 2.0% |
| Kenyans | 83.6 /100 | #145 | Excellent 1.9% |
| Immigrants | Syria | 83.6 /100 | #146 | Excellent 1.9% |
| Immigrants | Senegal | 82.5 /100 | #147 | Excellent 1.9% |
| Luxembourgers | 81.1 /100 | #148 | Excellent 1.9% |
| Basques | 76.9 /100 | #149 | Good 1.9% |
| English | 75.9 /100 | #150 | Good 1.9% |
| Albanians | 74.8 /100 | #151 | Good 1.9% |
| Immigrants | Kenya | 74.3 /100 | #152 | Good 1.9% |
| Immigrants | Oceania | 74.0 /100 | #153 | Good 1.9% |
Demographics Similar to Guatemalans by Doctorate Degree
In terms of doctorate degree, the demographic groups most similar to Guatemalans are Immigrants from Ecuador (1.4%, a difference of 0.23%), Tsimshian (1.4%, a difference of 0.45%), Samoan (1.4%, a difference of 0.70%), Puerto Rican (1.4%, a difference of 0.86%), and Belizean (1.4%, a difference of 1.3%).
| Demographics | Rating | Rank | Doctorate Degree |
| Immigrants | El Salvador | 0.3 /100 | #288 | Tragic 1.4% |
| Cape Verdeans | 0.3 /100 | #289 | Tragic 1.4% |
| Choctaw | 0.3 /100 | #290 | Tragic 1.4% |
| Blacks/African Americans | 0.3 /100 | #291 | Tragic 1.4% |
| Alaska Natives | 0.3 /100 | #292 | Tragic 1.4% |
| Immigrants | Yemen | 0.2 /100 | #293 | Tragic 1.4% |
| Samoans | 0.2 /100 | #294 | Tragic 1.4% |
| Guatemalans | 0.2 /100 | #295 | Tragic 1.4% |
| Immigrants | Ecuador | 0.2 /100 | #296 | Tragic 1.4% |
| Tsimshian | 0.2 /100 | #297 | Tragic 1.4% |
| Puerto Ricans | 0.1 /100 | #298 | Tragic 1.4% |
| Belizeans | 0.1 /100 | #299 | Tragic 1.4% |
| Immigrants | Guatemala | 0.1 /100 | #300 | Tragic 1.4% |
| Hondurans | 0.1 /100 | #301 | Tragic 1.4% |
| Shoshone | 0.1 /100 | #302 | Tragic 1.4% |