Bolivian vs Immigrants from Nicaragua 7th Grade
COMPARE
Bolivian
Immigrants from Nicaragua
7th Grade
7th Grade Comparison
Bolivians
Immigrants from Nicaragua
95.4%
7TH GRADE
1.1/ 100
METRIC RATING
249th/ 347
METRIC RANK
93.0%
7TH GRADE
0.0/ 100
METRIC RATING
328th/ 347
METRIC RANK
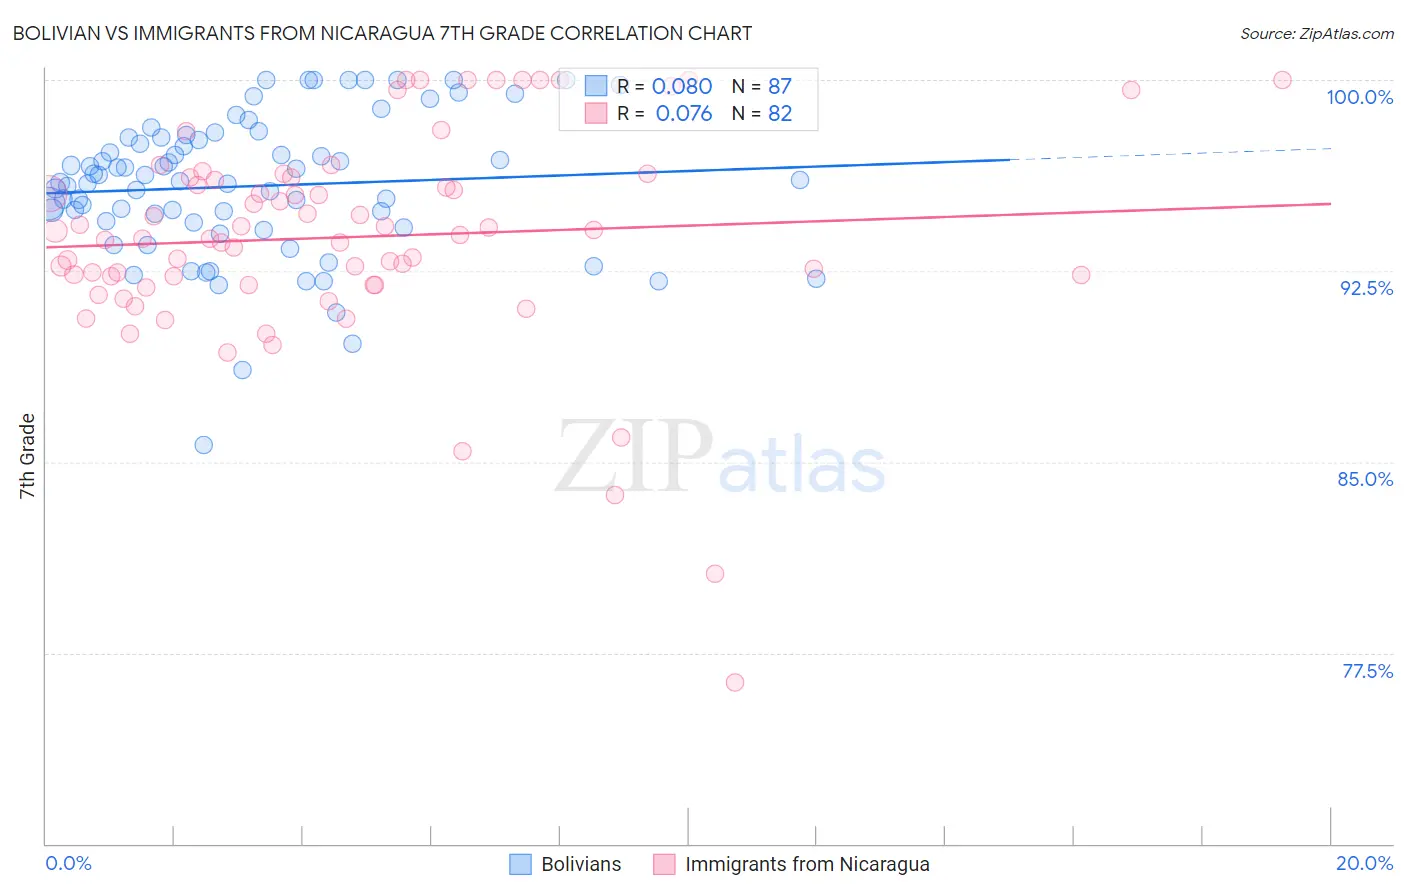
Bolivian vs Immigrants from Nicaragua 7th Grade Correlation Chart
The statistical analysis conducted on geographies consisting of 184,666,822 people shows a slight positive correlation between the proportion of Bolivians and percentage of population with at least 7th grade education in the United States with a correlation coefficient (R) of 0.080 and weighted average of 95.4%. Similarly, the statistical analysis conducted on geographies consisting of 236,340,506 people shows a slight positive correlation between the proportion of Immigrants from Nicaragua and percentage of population with at least 7th grade education in the United States with a correlation coefficient (R) of 0.076 and weighted average of 93.0%, a difference of 2.6%.
7th Grade Correlation Summary
| Measurement | Bolivian | Immigrants from Nicaragua |
| Minimum | 85.7% | 76.3% |
| Maximum | 100.0% | 100.0% |
| Range | 14.3% | 23.7% |
| Mean | 95.8% | 93.8% |
| Median | 96.0% | 93.8% |
| Interquartile 25% (IQ1) | 94.4% | 92.0% |
| Interquartile 75% (IQ3) | 97.7% | 96.2% |
| Interquartile Range (IQR) | 3.3% | 4.2% |
| Standard Deviation (Sample) | 2.8% | 4.2% |
| Standard Deviation (Population) | 2.8% | 4.2% |
Similar Demographics by 7th Grade
Demographics Similar to Bolivians by 7th Grade
In terms of 7th grade, the demographic groups most similar to Bolivians are Paiute (95.4%, a difference of 0.010%), Immigrants from Cameroon (95.4%, a difference of 0.020%), Immigrants from Jamaica (95.4%, a difference of 0.020%), Tongan (95.4%, a difference of 0.030%), and Immigrants from Ethiopia (95.3%, a difference of 0.030%).
| Demographics | Rating | Rank | 7th Grade |
| Immigrants | Senegal | 1.9 /100 | #242 | Tragic 95.5% |
| U.S. Virgin Islanders | 1.6 /100 | #243 | Tragic 95.4% |
| Uruguayans | 1.6 /100 | #244 | Tragic 95.4% |
| Immigrants | Middle Africa | 1.5 /100 | #245 | Tragic 95.4% |
| Ethiopians | 1.5 /100 | #246 | Tragic 95.4% |
| Tongans | 1.3 /100 | #247 | Tragic 95.4% |
| Paiute | 1.2 /100 | #248 | Tragic 95.4% |
| Bolivians | 1.1 /100 | #249 | Tragic 95.4% |
| Immigrants | Cameroon | 0.9 /100 | #250 | Tragic 95.4% |
| Immigrants | Jamaica | 0.9 /100 | #251 | Tragic 95.4% |
| Immigrants | Ethiopia | 0.9 /100 | #252 | Tragic 95.3% |
| Somalis | 0.9 /100 | #253 | Tragic 95.3% |
| Colombians | 0.8 /100 | #254 | Tragic 95.3% |
| Koreans | 0.8 /100 | #255 | Tragic 95.3% |
| Immigrants | China | 0.7 /100 | #256 | Tragic 95.3% |
Demographics Similar to Immigrants from Nicaragua by 7th Grade
In terms of 7th grade, the demographic groups most similar to Immigrants from Nicaragua are Immigrants from the Azores (93.0%, a difference of 0.040%), Immigrants from Dominican Republic (92.9%, a difference of 0.090%), Immigrants from Cabo Verde (93.1%, a difference of 0.13%), Honduran (92.9%, a difference of 0.13%), and Nepalese (93.2%, a difference of 0.20%).
| Demographics | Rating | Rank | 7th Grade |
| Belizeans | 0.0 /100 | #321 | Tragic 93.5% |
| Nicaraguans | 0.0 /100 | #322 | Tragic 93.5% |
| Immigrants | Belize | 0.0 /100 | #323 | Tragic 93.4% |
| Dominicans | 0.0 /100 | #324 | Tragic 93.3% |
| Central American Indians | 0.0 /100 | #325 | Tragic 93.3% |
| Nepalese | 0.0 /100 | #326 | Tragic 93.2% |
| Immigrants | Cabo Verde | 0.0 /100 | #327 | Tragic 93.1% |
| Immigrants | Nicaragua | 0.0 /100 | #328 | Tragic 93.0% |
| Immigrants | Azores | 0.0 /100 | #329 | Tragic 93.0% |
| Immigrants | Dominican Republic | 0.0 /100 | #330 | Tragic 92.9% |
| Hondurans | 0.0 /100 | #331 | Tragic 92.9% |
| Hispanics or Latinos | 0.0 /100 | #332 | Tragic 92.7% |
| Immigrants | Armenia | 0.0 /100 | #333 | Tragic 92.7% |
| Immigrants | Yemen | 0.0 /100 | #334 | Tragic 92.6% |
| Mexican American Indians | 0.0 /100 | #335 | Tragic 92.6% |