Immigrants from Colombia vs Nonimmigrants No Schooling Completed
COMPARE
Immigrants from Colombia
Nonimmigrants
No Schooling Completed
No Schooling Completed Comparison
Immigrants from Colombia
Nonimmigrants
2.4%
NO SCHOOLING COMPLETED
1.0/ 100
METRIC RATING
252nd/ 347
METRIC RANK
1.8%
NO SCHOOLING COMPLETED
98.5/ 100
METRIC RATING
94th/ 347
METRIC RANK
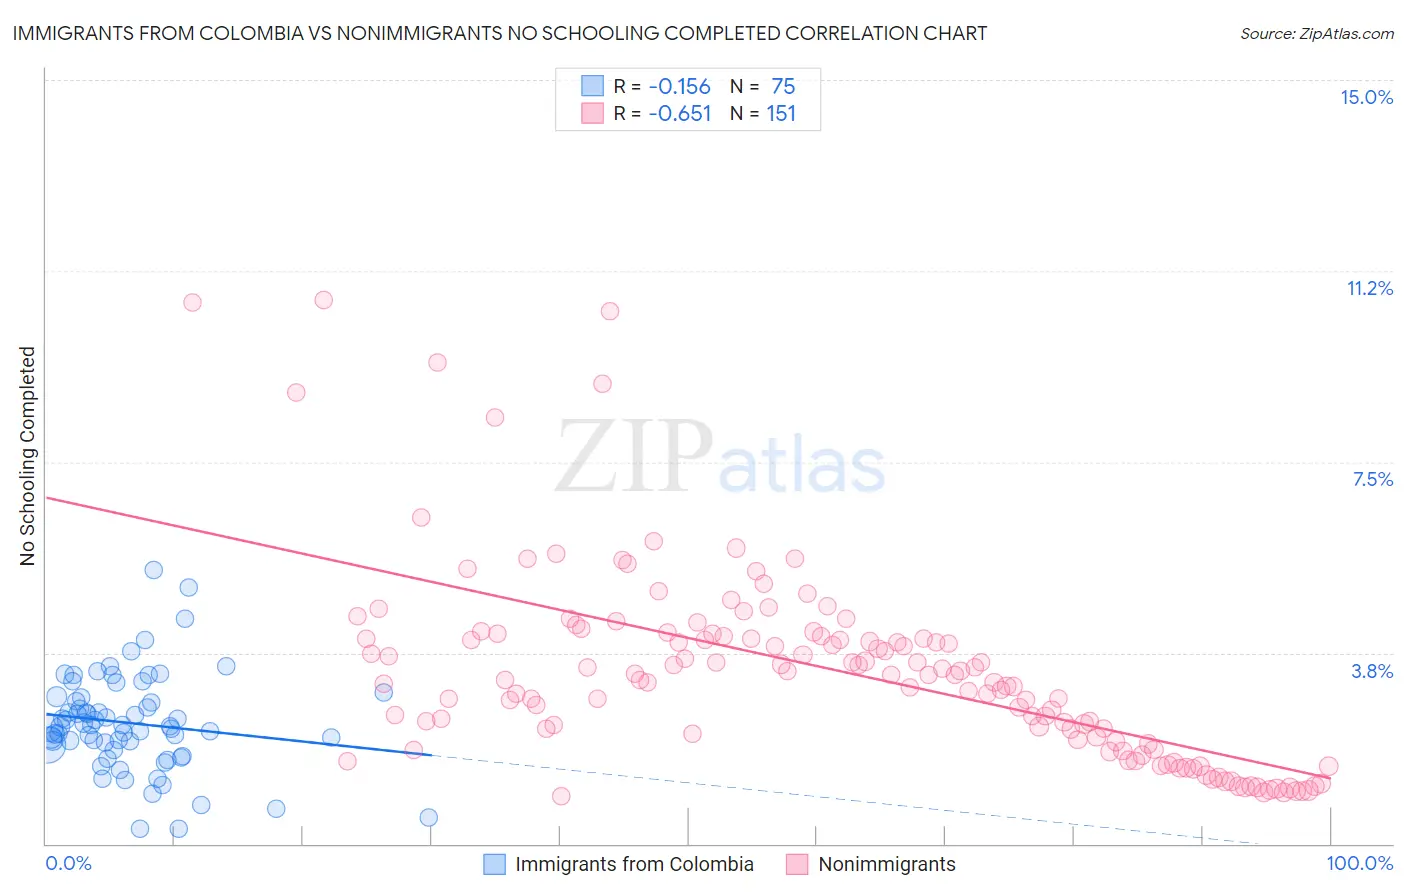
Immigrants from Colombia vs Nonimmigrants No Schooling Completed Correlation Chart
The statistical analysis conducted on geographies consisting of 375,786,629 people shows a poor negative correlation between the proportion of Immigrants from Colombia and percentage of population with no schooling in the United States with a correlation coefficient (R) of -0.156 and weighted average of 2.4%. Similarly, the statistical analysis conducted on geographies consisting of 562,676,251 people shows a significant negative correlation between the proportion of Nonimmigrants and percentage of population with no schooling in the United States with a correlation coefficient (R) of -0.651 and weighted average of 1.8%, a difference of 34.5%.
No Schooling Completed Correlation Summary
| Measurement | Immigrants from Colombia | Nonimmigrants |
| Minimum | 0.30% | 0.93% |
| Maximum | 5.4% | 10.7% |
| Range | 5.1% | 9.8% |
| Mean | 2.4% | 3.4% |
| Median | 2.3% | 3.3% |
| Interquartile 25% (IQ1) | 1.9% | 2.0% |
| Interquartile 75% (IQ3) | 2.9% | 4.1% |
| Interquartile Range (IQR) | 0.94% | 2.1% |
| Standard Deviation (Sample) | 0.95% | 1.9% |
| Standard Deviation (Population) | 0.94% | 1.9% |
Similar Demographics by No Schooling Completed
Demographics Similar to Immigrants from Colombia by No Schooling Completed
In terms of no schooling completed, the demographic groups most similar to Immigrants from Colombia are Immigrants from Asia (2.4%, a difference of 0.13%), Immigrants from Eastern Africa (2.4%, a difference of 0.25%), Immigrants from Africa (2.4%, a difference of 0.45%), Ethiopian (2.4%, a difference of 0.45%), and Immigrants from Middle Africa (2.4%, a difference of 0.46%).
| Demographics | Rating | Rank | No Schooling Completed |
| Bolivians | 1.4 /100 | #245 | Tragic 2.4% |
| Immigrants | Congo | 1.4 /100 | #246 | Tragic 2.4% |
| Immigrants | Iraq | 1.3 /100 | #247 | Tragic 2.4% |
| Asians | 1.2 /100 | #248 | Tragic 2.4% |
| Jamaicans | 1.2 /100 | #249 | Tragic 2.4% |
| Immigrants | Middle Africa | 1.1 /100 | #250 | Tragic 2.4% |
| Immigrants | Africa | 1.1 /100 | #251 | Tragic 2.4% |
| Immigrants | Colombia | 1.0 /100 | #252 | Tragic 2.4% |
| Immigrants | Asia | 0.9 /100 | #253 | Tragic 2.4% |
| Immigrants | Eastern Africa | 0.9 /100 | #254 | Tragic 2.4% |
| Ethiopians | 0.8 /100 | #255 | Tragic 2.4% |
| Yaqui | 0.8 /100 | #256 | Tragic 2.4% |
| Immigrants | South America | 0.6 /100 | #257 | Tragic 2.5% |
| Assyrians/Chaldeans/Syriacs | 0.6 /100 | #258 | Tragic 2.5% |
| Immigrants | Jamaica | 0.6 /100 | #259 | Tragic 2.5% |
Demographics Similar to Nonimmigrants by No Schooling Completed
In terms of no schooling completed, the demographic groups most similar to Nonimmigrants are Puget Sound Salish (1.8%, a difference of 0.010%), Bhutanese (1.8%, a difference of 0.24%), Immigrants from Ireland (1.8%, a difference of 0.42%), Turkish (1.8%, a difference of 0.50%), and Iranian (1.8%, a difference of 0.70%).
| Demographics | Rating | Rank | No Schooling Completed |
| Osage | 99.2 /100 | #87 | Exceptional 1.8% |
| Immigrants | Western Europe | 99.2 /100 | #88 | Exceptional 1.8% |
| South Africans | 99.1 /100 | #89 | Exceptional 1.8% |
| Sioux | 99.0 /100 | #90 | Exceptional 1.8% |
| Immigrants | Germany | 99.0 /100 | #91 | Exceptional 1.8% |
| Romanians | 98.8 /100 | #92 | Exceptional 1.8% |
| Turks | 98.7 /100 | #93 | Exceptional 1.8% |
| Immigrants | Nonimmigrants | 98.5 /100 | #94 | Exceptional 1.8% |
| Puget Sound Salish | 98.5 /100 | #95 | Exceptional 1.8% |
| Bhutanese | 98.4 /100 | #96 | Exceptional 1.8% |
| Immigrants | Ireland | 98.4 /100 | #97 | Exceptional 1.8% |
| Iranians | 98.2 /100 | #98 | Exceptional 1.8% |
| Choctaw | 98.1 /100 | #99 | Exceptional 1.8% |
| Immigrants | Singapore | 98.0 /100 | #100 | Exceptional 1.8% |
| Immigrants | Czechoslovakia | 97.9 /100 | #101 | Exceptional 1.8% |