Immigrants from Kuwait vs Immigrants from Turkey GED/Equivalency
COMPARE
Immigrants from Kuwait
Immigrants from Turkey
GED/Equivalency
GED/Equivalency Comparison
Immigrants from Kuwait
Immigrants from Turkey
87.7%
GED/EQUIVALENCY
98.8/ 100
METRIC RATING
74th/ 347
METRIC RANK
87.9%
GED/EQUIVALENCY
99.2/ 100
METRIC RATING
63rd/ 347
METRIC RANK
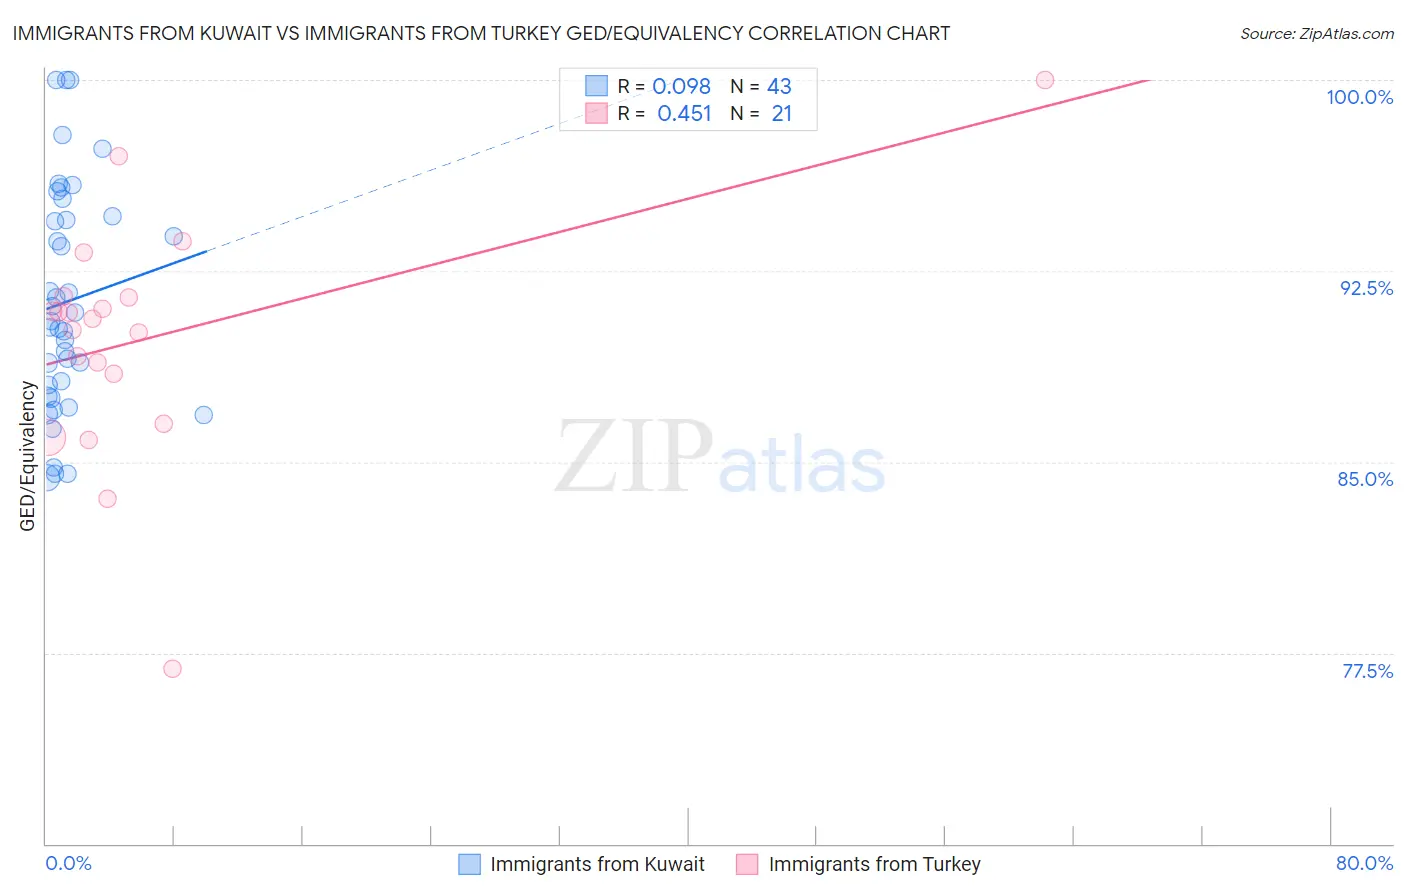
Immigrants from Kuwait vs Immigrants from Turkey GED/Equivalency Correlation Chart
The statistical analysis conducted on geographies consisting of 136,917,085 people shows a slight positive correlation between the proportion of Immigrants from Kuwait and percentage of population with at least ged/equivalency education in the United States with a correlation coefficient (R) of 0.098 and weighted average of 87.7%. Similarly, the statistical analysis conducted on geographies consisting of 223,057,775 people shows a moderate positive correlation between the proportion of Immigrants from Turkey and percentage of population with at least ged/equivalency education in the United States with a correlation coefficient (R) of 0.451 and weighted average of 87.9%, a difference of 0.24%.
GED/Equivalency Correlation Summary
| Measurement | Immigrants from Kuwait | Immigrants from Turkey |
| Minimum | 84.4% | 76.9% |
| Maximum | 100.0% | 100.0% |
| Range | 15.6% | 23.1% |
| Mean | 91.3% | 89.8% |
| Median | 90.5% | 90.6% |
| Interquartile 25% (IQ1) | 87.6% | 87.5% |
| Interquartile 75% (IQ3) | 94.6% | 91.5% |
| Interquartile Range (IQR) | 7.0% | 4.0% |
| Standard Deviation (Sample) | 4.4% | 4.7% |
| Standard Deviation (Population) | 4.3% | 4.6% |
Demographics Similar to Immigrants from Kuwait and Immigrants from Turkey by GED/Equivalency
In terms of ged/equivalency, the demographic groups most similar to Immigrants from Kuwait are Belgian (87.7%, a difference of 0.020%), Scottish (87.7%, a difference of 0.020%), Ukrainian (87.7%, a difference of 0.030%), Austrian (87.7%, a difference of 0.030%), and Immigrants from Moldova (87.7%, a difference of 0.030%). Similarly, the demographic groups most similar to Immigrants from Turkey are German (87.9%, a difference of 0.010%), Scandinavian (87.9%, a difference of 0.030%), European (87.9%, a difference of 0.030%), Serbian (87.9%, a difference of 0.040%), and Immigrants from Canada (87.9%, a difference of 0.040%).
| Demographics | Rating | Rank | GED/Equivalency |
| Northern Europeans | 99.3 /100 | #58 | Exceptional 87.9% |
| Serbians | 99.3 /100 | #59 | Exceptional 87.9% |
| Scandinavians | 99.3 /100 | #60 | Exceptional 87.9% |
| Europeans | 99.3 /100 | #61 | Exceptional 87.9% |
| Germans | 99.3 /100 | #62 | Exceptional 87.9% |
| Immigrants | Turkey | 99.2 /100 | #63 | Exceptional 87.9% |
| Immigrants | Canada | 99.2 /100 | #64 | Exceptional 87.9% |
| Immigrants | North America | 99.1 /100 | #65 | Exceptional 87.8% |
| Immigrants | Bulgaria | 99.1 /100 | #66 | Exceptional 87.8% |
| British | 99.1 /100 | #67 | Exceptional 87.8% |
| Immigrants | France | 99.1 /100 | #68 | Exceptional 87.8% |
| Immigrants | Saudi Arabia | 99.0 /100 | #69 | Exceptional 87.8% |
| Ukrainians | 98.8 /100 | #70 | Exceptional 87.7% |
| Austrians | 98.8 /100 | #71 | Exceptional 87.7% |
| Immigrants | Moldova | 98.8 /100 | #72 | Exceptional 87.7% |
| Belgians | 98.8 /100 | #73 | Exceptional 87.7% |
| Immigrants | Kuwait | 98.8 /100 | #74 | Exceptional 87.7% |
| Scottish | 98.7 /100 | #75 | Exceptional 87.7% |
| Immigrants | Serbia | 98.7 /100 | #76 | Exceptional 87.7% |
| Slavs | 98.7 /100 | #77 | Exceptional 87.7% |
| Irish | 98.6 /100 | #78 | Exceptional 87.6% |