African vs Immigrants from Morocco No Schooling Completed
COMPARE
African
Immigrants from Morocco
No Schooling Completed
No Schooling Completed Comparison
Africans
Immigrants from Morocco
2.2%
NO SCHOOLING COMPLETED
21.8/ 100
METRIC RATING
199th/ 347
METRIC RANK
2.3%
NO SCHOOLING COMPLETED
8.7/ 100
METRIC RATING
212th/ 347
METRIC RANK
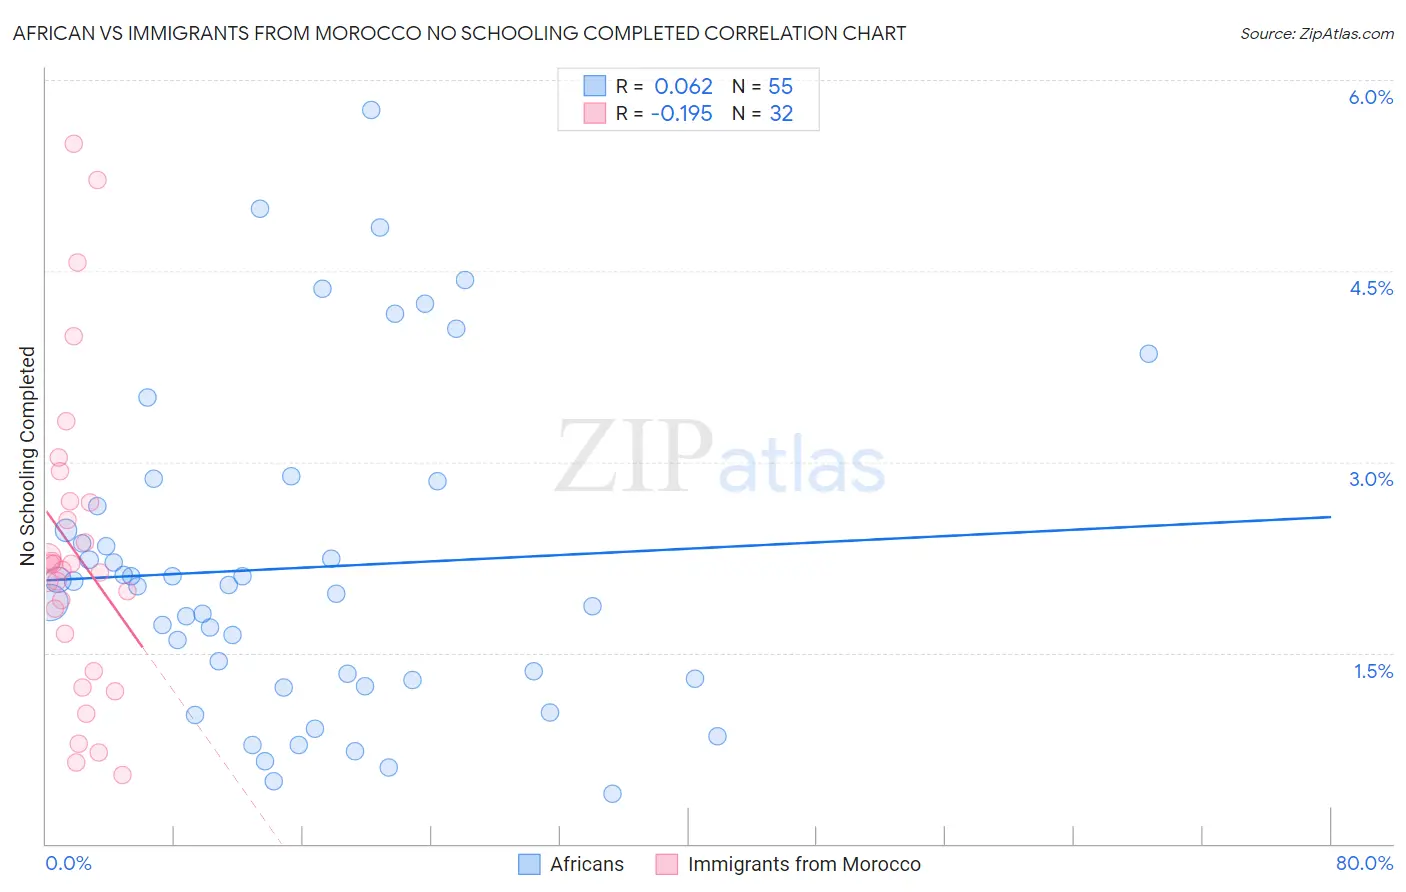
African vs Immigrants from Morocco No Schooling Completed Correlation Chart
The statistical analysis conducted on geographies consisting of 465,007,886 people shows a slight positive correlation between the proportion of Africans and percentage of population with no schooling in the United States with a correlation coefficient (R) of 0.062 and weighted average of 2.2%. Similarly, the statistical analysis conducted on geographies consisting of 178,575,563 people shows a poor negative correlation between the proportion of Immigrants from Morocco and percentage of population with no schooling in the United States with a correlation coefficient (R) of -0.195 and weighted average of 2.3%, a difference of 3.5%.
No Schooling Completed Correlation Summary
| Measurement | African | Immigrants from Morocco |
| Minimum | 0.39% | 0.54% |
| Maximum | 5.8% | 5.5% |
| Range | 5.4% | 5.0% |
| Mean | 2.2% | 2.3% |
| Median | 2.0% | 2.2% |
| Interquartile 25% (IQ1) | 1.3% | 1.5% |
| Interquartile 75% (IQ3) | 2.7% | 2.7% |
| Interquartile Range (IQR) | 1.4% | 1.2% |
| Standard Deviation (Sample) | 1.3% | 1.2% |
| Standard Deviation (Population) | 1.2% | 1.2% |
Demographics Similar to Africans and Immigrants from Morocco by No Schooling Completed
In terms of no schooling completed, the demographic groups most similar to Africans are Immigrants from Chile (2.2%, a difference of 0.17%), Immigrants from Southern Europe (2.2%, a difference of 0.35%), Immigrants from Northern Africa (2.2%, a difference of 0.46%), Immigrants from Ukraine (2.2%, a difference of 0.77%), and Hawaiian (2.2%, a difference of 0.92%). Similarly, the demographic groups most similar to Immigrants from Morocco are Immigrants from Panama (2.3%, a difference of 0.010%), Ute (2.3%, a difference of 0.19%), Samoan (2.3%, a difference of 0.23%), Native/Alaskan (2.2%, a difference of 0.46%), and Immigrants from Oceania (2.2%, a difference of 0.54%).
| Demographics | Rating | Rank | No Schooling Completed |
| Hawaiians | 27.0 /100 | #195 | Fair 2.2% |
| Immigrants | Ukraine | 26.1 /100 | #196 | Fair 2.2% |
| Immigrants | Southern Europe | 23.8 /100 | #197 | Fair 2.2% |
| Immigrants | Chile | 22.7 /100 | #198 | Fair 2.2% |
| Africans | 21.8 /100 | #199 | Fair 2.2% |
| Immigrants | Northern Africa | 19.5 /100 | #200 | Poor 2.2% |
| Costa Ricans | 17.1 /100 | #201 | Poor 2.2% |
| Moroccans | 13.7 /100 | #202 | Poor 2.2% |
| Laotians | 13.3 /100 | #203 | Poor 2.2% |
| Hopi | 12.9 /100 | #204 | Poor 2.2% |
| Immigrants | Bahamas | 11.6 /100 | #205 | Poor 2.2% |
| Bahamians | 11.6 /100 | #206 | Poor 2.2% |
| South American Indians | 11.0 /100 | #207 | Poor 2.2% |
| Uruguayans | 11.0 /100 | #208 | Poor 2.2% |
| Immigrants | Oceania | 10.2 /100 | #209 | Poor 2.2% |
| Natives/Alaskans | 10.0 /100 | #210 | Tragic 2.2% |
| Immigrants | Panama | 8.8 /100 | #211 | Tragic 2.3% |
| Immigrants | Morocco | 8.7 /100 | #212 | Tragic 2.3% |
| Ute | 8.2 /100 | #213 | Tragic 2.3% |
| Samoans | 8.2 /100 | #214 | Tragic 2.3% |
| Immigrants | Zaire | 7.2 /100 | #215 | Tragic 2.3% |