Black/African American vs Israeli Nursery School
COMPARE
Black/African American
Israeli
Nursery School
Nursery School Comparison
Blacks/African Americans
Israelis
97.9%
NURSERY SCHOOL
29.4/ 100
METRIC RATING
192nd/ 347
METRIC RANK
98.1%
NURSERY SCHOOL
88.2/ 100
METRIC RATING
137th/ 347
METRIC RANK
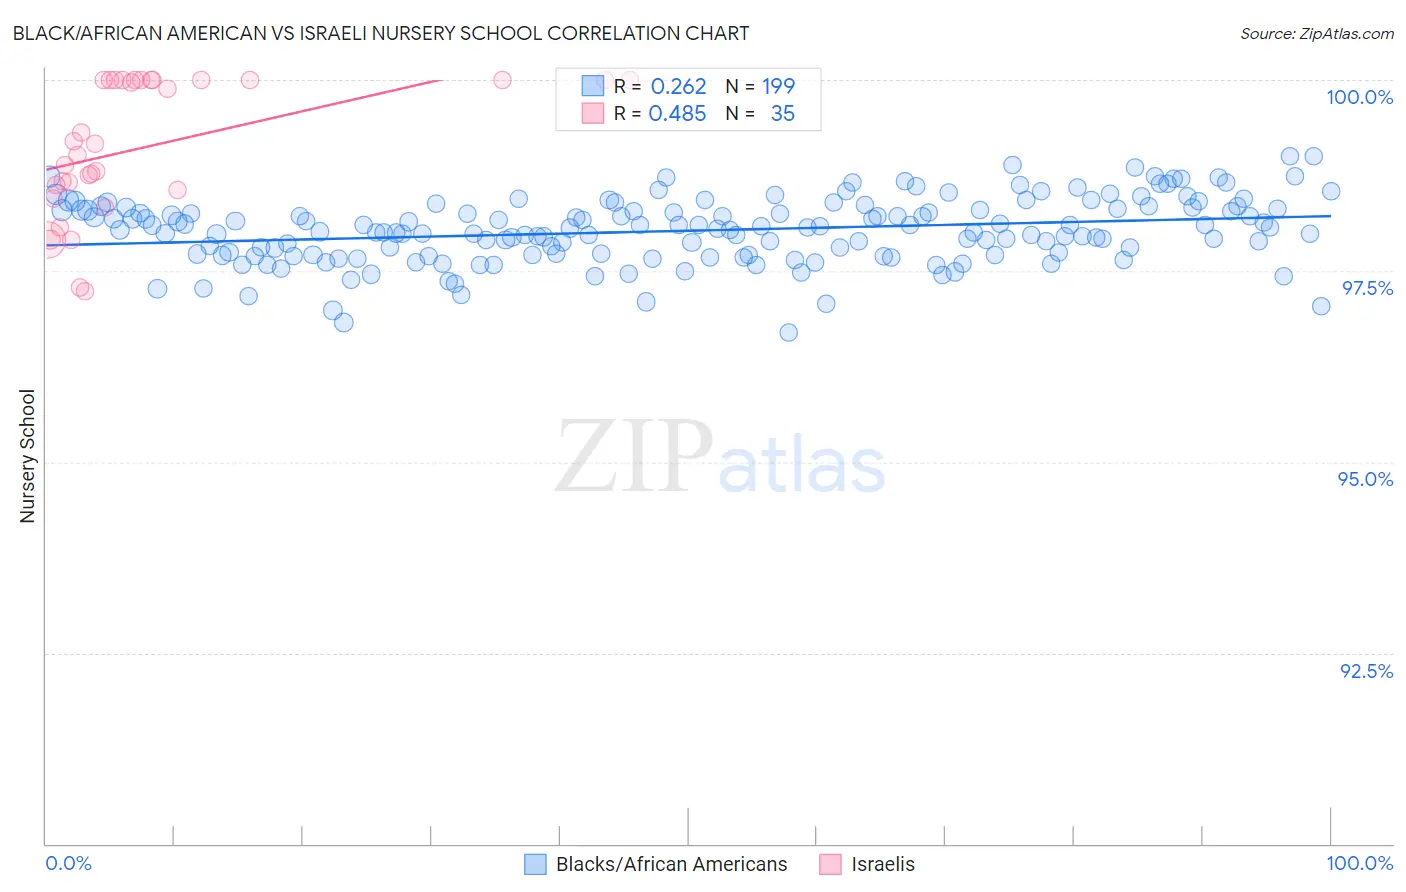
Black/African American vs Israeli Nursery School Correlation Chart
The statistical analysis conducted on geographies consisting of 566,043,750 people shows a weak positive correlation between the proportion of Blacks/African Americans and percentage of population with at least nursery school education in the United States with a correlation coefficient (R) of 0.262 and weighted average of 97.9%. Similarly, the statistical analysis conducted on geographies consisting of 211,219,690 people shows a moderate positive correlation between the proportion of Israelis and percentage of population with at least nursery school education in the United States with a correlation coefficient (R) of 0.485 and weighted average of 98.1%, a difference of 0.22%.
Nursery School Correlation Summary
| Measurement | Black/African American | Israeli |
| Minimum | 96.7% | 97.2% |
| Maximum | 99.0% | 100.0% |
| Range | 2.3% | 2.8% |
| Mean | 98.0% | 99.1% |
| Median | 98.0% | 99.2% |
| Interquartile 25% (IQ1) | 97.7% | 98.6% |
| Interquartile 75% (IQ3) | 98.3% | 100.0% |
| Interquartile Range (IQR) | 0.60% | 1.4% |
| Standard Deviation (Sample) | 0.42% | 0.88% |
| Standard Deviation (Population) | 0.42% | 0.87% |
Similar Demographics by Nursery School
Demographics Similar to Blacks/African Americans by Nursery School
In terms of nursery school, the demographic groups most similar to Blacks/African Americans are Immigrants from Taiwan (97.9%, a difference of 0.0%), Paraguayan (97.9%, a difference of 0.010%), Mongolian (97.9%, a difference of 0.010%), Hawaiian (97.9%, a difference of 0.010%), and Guamanian/Chamorro (97.9%, a difference of 0.010%).
| Demographics | Rating | Rank | Nursery School |
| Immigrants | Belarus | 41.0 /100 | #185 | Average 98.0% |
| Immigrants | Argentina | 40.8 /100 | #186 | Average 98.0% |
| Immigrants | Kazakhstan | 37.1 /100 | #187 | Fair 97.9% |
| Arabs | 34.7 /100 | #188 | Fair 97.9% |
| Pakistanis | 34.6 /100 | #189 | Fair 97.9% |
| Panamanians | 34.3 /100 | #190 | Fair 97.9% |
| Immigrants | Taiwan | 30.6 /100 | #191 | Fair 97.9% |
| Blacks/African Americans | 29.4 /100 | #192 | Fair 97.9% |
| Paraguayans | 27.4 /100 | #193 | Fair 97.9% |
| Mongolians | 27.3 /100 | #194 | Fair 97.9% |
| Hawaiians | 27.2 /100 | #195 | Fair 97.9% |
| Guamanians/Chamorros | 25.7 /100 | #196 | Fair 97.9% |
| Yuman | 25.7 /100 | #197 | Fair 97.9% |
| Immigrants | Kenya | 24.1 /100 | #198 | Fair 97.9% |
| Immigrants | Egypt | 22.5 /100 | #199 | Fair 97.9% |
Demographics Similar to Israelis by Nursery School
In terms of nursery school, the demographic groups most similar to Israelis are Immigrants from Romania (98.1%, a difference of 0.0%), Blackfeet (98.1%, a difference of 0.0%), Immigrants from Bulgaria (98.1%, a difference of 0.010%), Immigrants from Hungary (98.1%, a difference of 0.010%), and Immigrants from Kuwait (98.1%, a difference of 0.010%).
| Demographics | Rating | Rank | Nursery School |
| Immigrants | Croatia | 91.4 /100 | #130 | Exceptional 98.2% |
| Spaniards | 91.1 /100 | #131 | Exceptional 98.2% |
| Seminole | 90.9 /100 | #132 | Exceptional 98.2% |
| Immigrants | Europe | 90.7 /100 | #133 | Exceptional 98.1% |
| Immigrants | Bulgaria | 89.4 /100 | #134 | Excellent 98.1% |
| Immigrants | Hungary | 89.3 /100 | #135 | Excellent 98.1% |
| Immigrants | Kuwait | 88.9 /100 | #136 | Excellent 98.1% |
| Israelis | 88.2 /100 | #137 | Excellent 98.1% |
| Immigrants | Romania | 88.0 /100 | #138 | Excellent 98.1% |
| Blackfeet | 87.5 /100 | #139 | Excellent 98.1% |
| Palestinians | 83.7 /100 | #140 | Excellent 98.1% |
| Immigrants | Turkey | 83.0 /100 | #141 | Excellent 98.1% |
| Burmese | 81.7 /100 | #142 | Excellent 98.1% |
| Marshallese | 81.2 /100 | #143 | Excellent 98.1% |
| Alsatians | 80.3 /100 | #144 | Excellent 98.1% |