Black/African American vs Immigrants from Lithuania 5th Grade
COMPARE
Black/African American
Immigrants from Lithuania
5th Grade
5th Grade Comparison
Blacks/African Americans
Immigrants from Lithuania
97.3%
5TH GRADE
31.8/ 100
METRIC RATING
190th/ 347
METRIC RANK
97.8%
5TH GRADE
99.2/ 100
METRIC RATING
79th/ 347
METRIC RANK
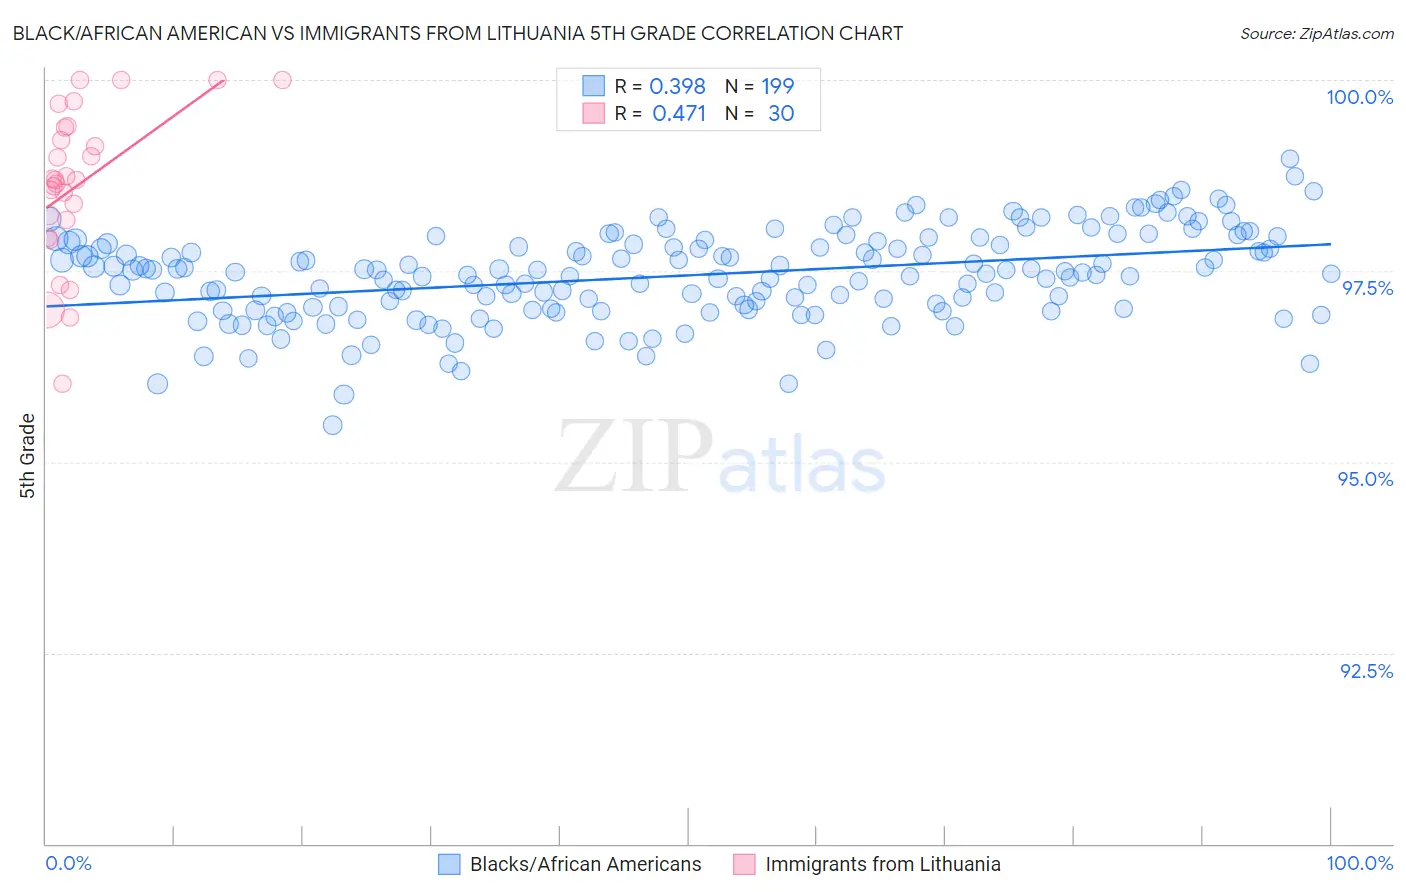
Black/African American vs Immigrants from Lithuania 5th Grade Correlation Chart
The statistical analysis conducted on geographies consisting of 566,043,750 people shows a mild positive correlation between the proportion of Blacks/African Americans and percentage of population with at least 5th grade education in the United States with a correlation coefficient (R) of 0.398 and weighted average of 97.3%. Similarly, the statistical analysis conducted on geographies consisting of 117,724,932 people shows a moderate positive correlation between the proportion of Immigrants from Lithuania and percentage of population with at least 5th grade education in the United States with a correlation coefficient (R) of 0.471 and weighted average of 97.8%, a difference of 0.58%.
5th Grade Correlation Summary
| Measurement | Black/African American | Immigrants from Lithuania |
| Minimum | 95.5% | 96.0% |
| Maximum | 99.0% | 100.0% |
| Range | 3.5% | 4.0% |
| Mean | 97.4% | 98.6% |
| Median | 97.5% | 98.7% |
| Interquartile 25% (IQ1) | 97.0% | 98.2% |
| Interquartile 75% (IQ3) | 97.9% | 99.4% |
| Interquartile Range (IQR) | 0.85% | 1.2% |
| Standard Deviation (Sample) | 0.59% | 1.0% |
| Standard Deviation (Population) | 0.59% | 0.99% |
Similar Demographics by 5th Grade
Demographics Similar to Blacks/African Americans by 5th Grade
In terms of 5th grade, the demographic groups most similar to Blacks/African Americans are Immigrants from Brazil (97.3%, a difference of 0.0%), Panamanian (97.3%, a difference of 0.0%), Spanish American (97.3%, a difference of 0.010%), Paraguayan (97.3%, a difference of 0.010%), and Immigrants from Egypt (97.3%, a difference of 0.010%).
| Demographics | Rating | Rank | 5th Grade |
| Immigrants | Ukraine | 38.6 /100 | #183 | Fair 97.3% |
| Immigrants | Venezuela | 38.4 /100 | #184 | Fair 97.3% |
| Dutch West Indians | 36.2 /100 | #185 | Fair 97.3% |
| Immigrants | Argentina | 36.1 /100 | #186 | Fair 97.3% |
| Spanish Americans | 34.7 /100 | #187 | Fair 97.3% |
| Paraguayans | 33.7 /100 | #188 | Fair 97.3% |
| Immigrants | Egypt | 32.9 /100 | #189 | Fair 97.3% |
| Blacks/African Americans | 31.8 /100 | #190 | Fair 97.3% |
| Immigrants | Brazil | 31.5 /100 | #191 | Fair 97.3% |
| Panamanians | 31.3 /100 | #192 | Fair 97.3% |
| Navajo | 29.0 /100 | #193 | Fair 97.2% |
| Immigrants | Albania | 28.5 /100 | #194 | Fair 97.2% |
| Guamanians/Chamorros | 26.8 /100 | #195 | Fair 97.2% |
| Hawaiians | 25.6 /100 | #196 | Fair 97.2% |
| Brazilians | 25.4 /100 | #197 | Fair 97.2% |
Demographics Similar to Immigrants from Lithuania by 5th Grade
In terms of 5th grade, the demographic groups most similar to Immigrants from Lithuania are Immigrants from India (97.8%, a difference of 0.0%), Icelander (97.8%, a difference of 0.0%), Ukrainian (97.8%, a difference of 0.010%), Immigrants from Netherlands (97.8%, a difference of 0.010%), and Immigrants from England (97.8%, a difference of 0.010%).
| Demographics | Rating | Rank | 5th Grade |
| Macedonians | 99.4 /100 | #72 | Exceptional 97.9% |
| Cherokee | 99.4 /100 | #73 | Exceptional 97.8% |
| Lumbee | 99.3 /100 | #74 | Exceptional 97.8% |
| Ukrainians | 99.3 /100 | #75 | Exceptional 97.8% |
| Immigrants | Netherlands | 99.3 /100 | #76 | Exceptional 97.8% |
| Immigrants | England | 99.3 /100 | #77 | Exceptional 97.8% |
| Osage | 99.3 /100 | #78 | Exceptional 97.8% |
| Immigrants | Lithuania | 99.2 /100 | #79 | Exceptional 97.8% |
| Immigrants | India | 99.2 /100 | #80 | Exceptional 97.8% |
| Icelanders | 99.2 /100 | #81 | Exceptional 97.8% |
| Pueblo | 99.2 /100 | #82 | Exceptional 97.8% |
| Zimbabweans | 99.0 /100 | #83 | Exceptional 97.8% |
| Potawatomi | 99.0 /100 | #84 | Exceptional 97.8% |
| Immigrants | Belgium | 99.0 /100 | #85 | Exceptional 97.8% |
| Cypriots | 98.9 /100 | #86 | Exceptional 97.8% |