Immigrants from Serbia vs Apache 5th Grade
COMPARE
Immigrants from Serbia
Apache
5th Grade
5th Grade Comparison
Immigrants from Serbia
Apache
97.6%
5TH GRADE
92.3/ 100
METRIC RATING
127th/ 347
METRIC RANK
97.4%
5TH GRADE
57.2/ 100
METRIC RATING
166th/ 347
METRIC RANK
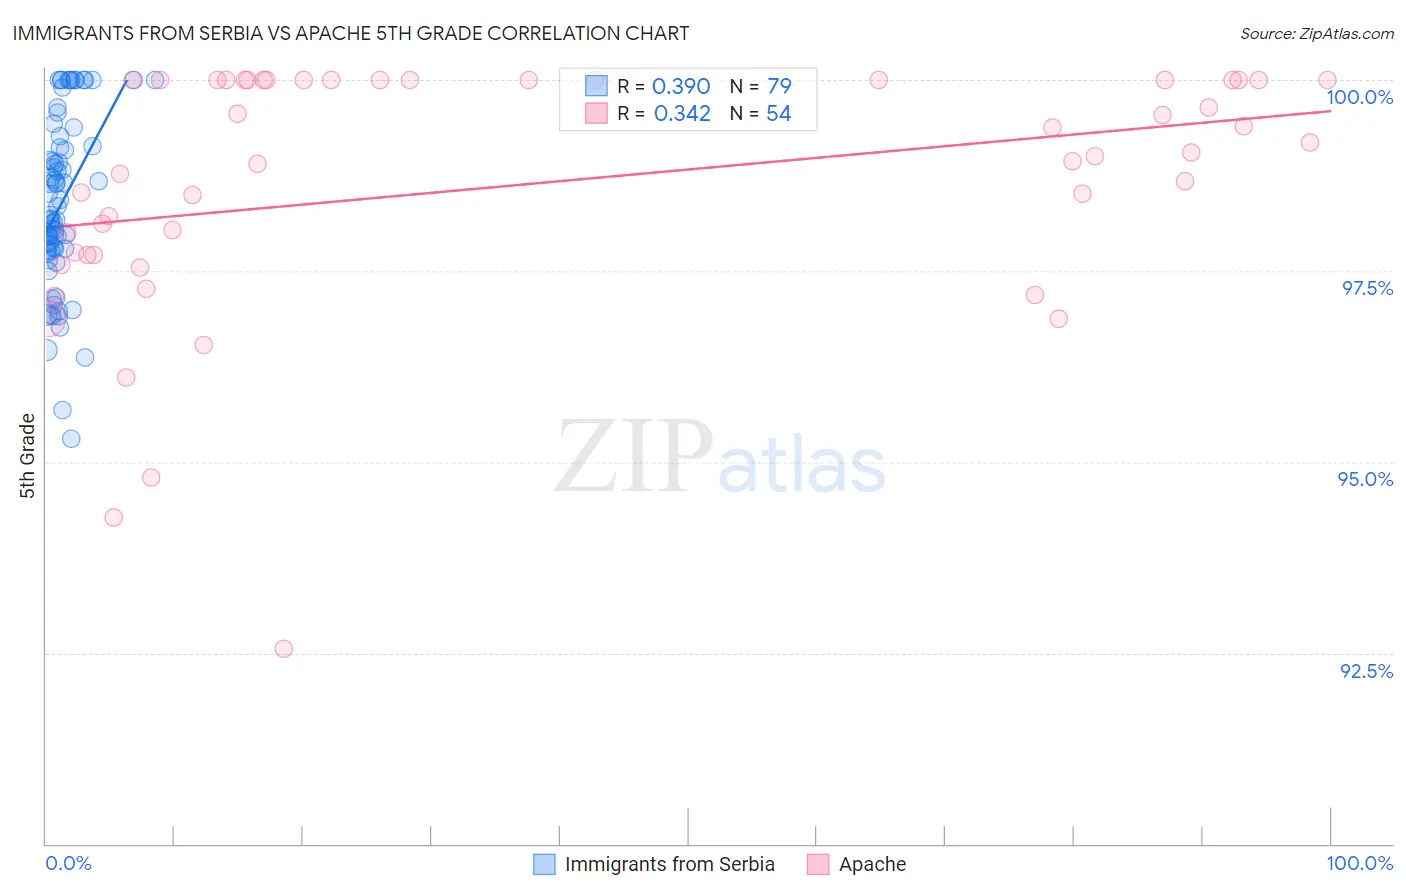
Immigrants from Serbia vs Apache 5th Grade Correlation Chart
The statistical analysis conducted on geographies consisting of 131,729,423 people shows a mild positive correlation between the proportion of Immigrants from Serbia and percentage of population with at least 5th grade education in the United States with a correlation coefficient (R) of 0.390 and weighted average of 97.6%. Similarly, the statistical analysis conducted on geographies consisting of 231,142,814 people shows a mild positive correlation between the proportion of Apache and percentage of population with at least 5th grade education in the United States with a correlation coefficient (R) of 0.342 and weighted average of 97.4%, a difference of 0.23%.
5th Grade Correlation Summary
| Measurement | Immigrants from Serbia | Apache |
| Minimum | 95.3% | 92.5% |
| Maximum | 100.0% | 100.0% |
| Range | 4.7% | 7.5% |
| Mean | 98.4% | 98.6% |
| Median | 98.2% | 99.0% |
| Interquartile 25% (IQ1) | 97.8% | 97.7% |
| Interquartile 75% (IQ3) | 99.1% | 100.0% |
| Interquartile Range (IQR) | 1.4% | 2.3% |
| Standard Deviation (Sample) | 1.1% | 1.6% |
| Standard Deviation (Population) | 1.1% | 1.6% |
Similar Demographics by 5th Grade
Demographics Similar to Immigrants from Serbia by 5th Grade
In terms of 5th grade, the demographic groups most similar to Immigrants from Serbia are Hmong (97.6%, a difference of 0.0%), Colville (97.6%, a difference of 0.0%), Immigrants from Bulgaria (97.6%, a difference of 0.010%), Immigrants from Europe (97.6%, a difference of 0.010%), and Immigrants from Romania (97.6%, a difference of 0.010%).
| Demographics | Rating | Rank | 5th Grade |
| Immigrants | Zimbabwe | 94.9 /100 | #120 | Exceptional 97.6% |
| Immigrants | France | 94.8 /100 | #121 | Exceptional 97.6% |
| Immigrants | Japan | 94.7 /100 | #122 | Exceptional 97.6% |
| Immigrants | Norway | 94.6 /100 | #123 | Exceptional 97.6% |
| Spanish | 93.7 /100 | #124 | Exceptional 97.6% |
| Immigrants | Bulgaria | 93.1 /100 | #125 | Exceptional 97.6% |
| Hmong | 92.3 /100 | #126 | Exceptional 97.6% |
| Immigrants | Serbia | 92.3 /100 | #127 | Exceptional 97.6% |
| Colville | 92.0 /100 | #128 | Exceptional 97.6% |
| Immigrants | Europe | 91.9 /100 | #129 | Exceptional 97.6% |
| Immigrants | Romania | 91.6 /100 | #130 | Exceptional 97.6% |
| Pima | 91.2 /100 | #131 | Exceptional 97.6% |
| Immigrants | Kuwait | 90.4 /100 | #132 | Exceptional 97.6% |
| Cambodians | 90.2 /100 | #133 | Exceptional 97.6% |
| Immigrants | Hungary | 90.1 /100 | #134 | Exceptional 97.6% |
Demographics Similar to Apache by 5th Grade
In terms of 5th grade, the demographic groups most similar to Apache are Immigrants from Poland (97.4%, a difference of 0.0%), Kenyan (97.4%, a difference of 0.010%), Immigrants from Iran (97.4%, a difference of 0.010%), Ugandan (97.4%, a difference of 0.010%), and Bermudan (97.4%, a difference of 0.010%).
| Demographics | Rating | Rank | 5th Grade |
| Immigrants | Italy | 65.2 /100 | #159 | Good 97.4% |
| Marshallese | 61.2 /100 | #160 | Good 97.4% |
| Kenyans | 59.7 /100 | #161 | Average 97.4% |
| Immigrants | Iran | 59.5 /100 | #162 | Average 97.4% |
| Ugandans | 58.9 /100 | #163 | Average 97.4% |
| Bermudans | 58.8 /100 | #164 | Average 97.4% |
| Immigrants | Poland | 57.9 /100 | #165 | Average 97.4% |
| Apache | 57.2 /100 | #166 | Average 97.4% |
| Immigrants | Belarus | 54.6 /100 | #167 | Average 97.3% |
| Chileans | 54.5 /100 | #168 | Average 97.3% |
| Immigrants | Korea | 54.1 /100 | #169 | Average 97.3% |
| Venezuelans | 54.0 /100 | #170 | Average 97.3% |
| Immigrants | Sri Lanka | 53.8 /100 | #171 | Average 97.3% |
| Arabs | 53.4 /100 | #172 | Average 97.3% |
| Egyptians | 52.4 /100 | #173 | Average 97.3% |