Blackfeet vs French American Indian Associate's Degree
COMPARE
Blackfeet
French American Indian
Associate's Degree
Associate's Degree Comparison
Blackfeet
French American Indians
40.3%
ASSOCIATE'S DEGREE
0.1/ 100
METRIC RATING
277th/ 347
METRIC RANK
42.0%
ASSOCIATE'S DEGREE
0.6/ 100
METRIC RATING
252nd/ 347
METRIC RANK
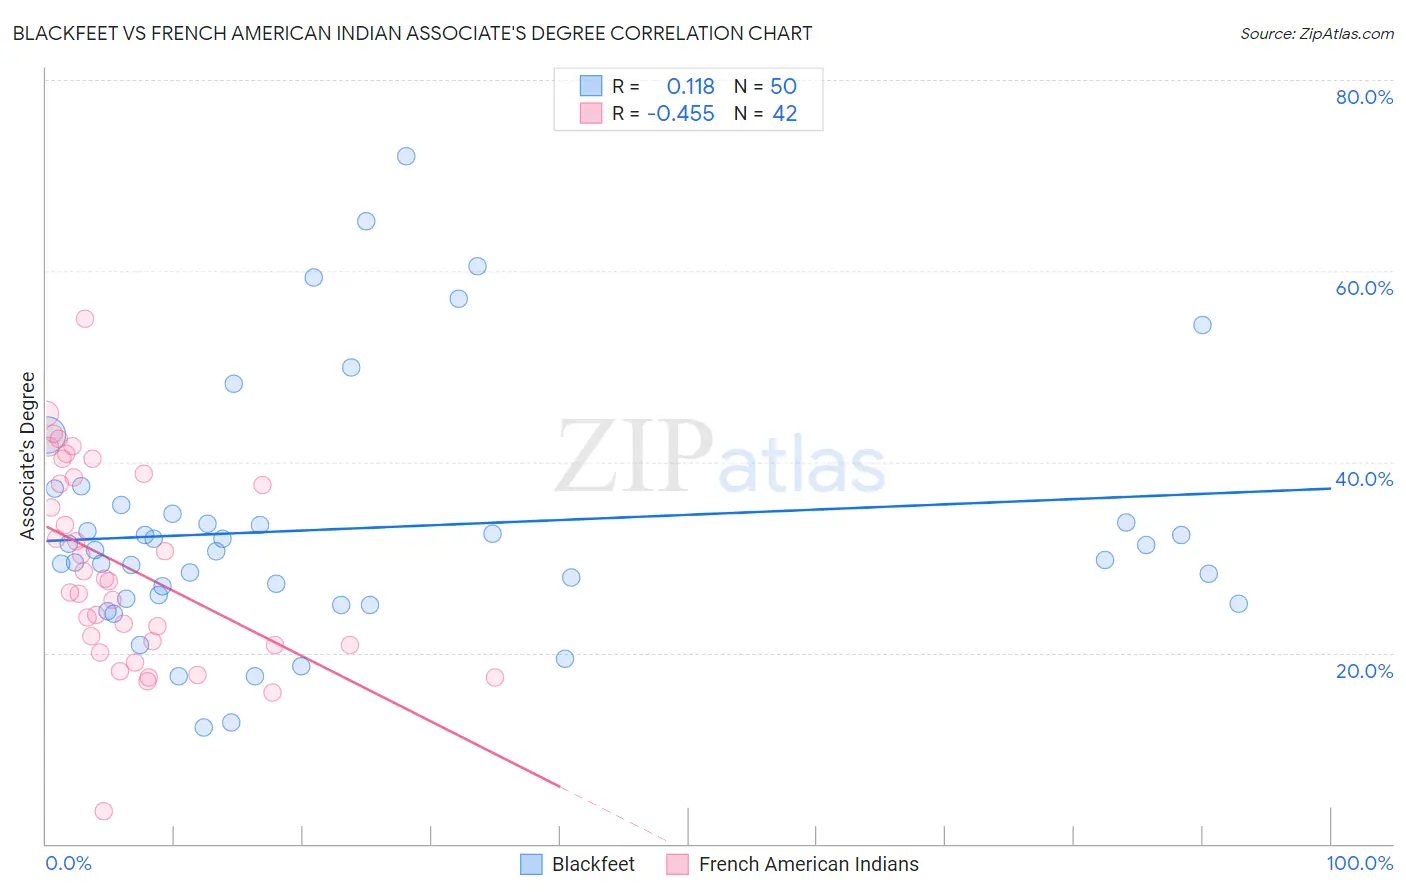
Blackfeet vs French American Indian Associate's Degree Correlation Chart
The statistical analysis conducted on geographies consisting of 309,580,719 people shows a poor positive correlation between the proportion of Blackfeet and percentage of population with at least associate's degree education in the United States with a correlation coefficient (R) of 0.118 and weighted average of 40.3%. Similarly, the statistical analysis conducted on geographies consisting of 131,974,565 people shows a moderate negative correlation between the proportion of French American Indians and percentage of population with at least associate's degree education in the United States with a correlation coefficient (R) of -0.455 and weighted average of 42.0%, a difference of 4.0%.
Associate's Degree Correlation Summary
| Measurement | Blackfeet | French American Indian |
| Minimum | 12.2% | 3.4% |
| Maximum | 72.0% | 55.0% |
| Range | 59.8% | 51.5% |
| Mean | 33.0% | 29.1% |
| Median | 30.7% | 27.6% |
| Interquartile 25% (IQ1) | 25.7% | 20.8% |
| Interquartile 75% (IQ3) | 34.5% | 38.3% |
| Interquartile Range (IQR) | 8.8% | 17.5% |
| Standard Deviation (Sample) | 13.0% | 10.5% |
| Standard Deviation (Population) | 12.8% | 10.4% |
Similar Demographics by Associate's Degree
Demographics Similar to Blackfeet by Associate's Degree
In terms of associate's degree, the demographic groups most similar to Blackfeet are Puerto Rican (40.4%, a difference of 0.050%), Ottawa (40.3%, a difference of 0.15%), Potawatomi (40.4%, a difference of 0.16%), Immigrants from Nicaragua (40.3%, a difference of 0.19%), and Immigrants from Dominica (40.5%, a difference of 0.30%).
| Demographics | Rating | Rank | Associate's Degree |
| Chippewa | 0.2 /100 | #270 | Tragic 40.7% |
| Immigrants | Laos | 0.1 /100 | #271 | Tragic 40.7% |
| Belizeans | 0.1 /100 | #272 | Tragic 40.6% |
| Puget Sound Salish | 0.1 /100 | #273 | Tragic 40.5% |
| Immigrants | Dominica | 0.1 /100 | #274 | Tragic 40.5% |
| Potawatomi | 0.1 /100 | #275 | Tragic 40.4% |
| Puerto Ricans | 0.1 /100 | #276 | Tragic 40.4% |
| Blackfeet | 0.1 /100 | #277 | Tragic 40.3% |
| Ottawa | 0.1 /100 | #278 | Tragic 40.3% |
| Immigrants | Nicaragua | 0.1 /100 | #279 | Tragic 40.3% |
| Immigrants | Micronesia | 0.1 /100 | #280 | Tragic 40.2% |
| Immigrants | Portugal | 0.1 /100 | #281 | Tragic 40.1% |
| Bangladeshis | 0.1 /100 | #282 | Tragic 40.0% |
| Haitians | 0.1 /100 | #283 | Tragic 40.0% |
| Comanche | 0.1 /100 | #284 | Tragic 39.9% |
Demographics Similar to French American Indians by Associate's Degree
In terms of associate's degree, the demographic groups most similar to French American Indians are Indonesian (41.9%, a difference of 0.10%), Cuban (41.9%, a difference of 0.17%), Immigrants from Guyana (41.8%, a difference of 0.25%), Immigrants from Bahamas (42.1%, a difference of 0.36%), and U.S. Virgin Islander (42.1%, a difference of 0.38%).
| Demographics | Rating | Rank | Associate's Degree |
| Immigrants | Cambodia | 0.9 /100 | #245 | Tragic 42.3% |
| Delaware | 0.9 /100 | #246 | Tragic 42.3% |
| Immigrants | Fiji | 0.8 /100 | #247 | Tragic 42.2% |
| Immigrants | Ecuador | 0.8 /100 | #248 | Tragic 42.2% |
| Jamaicans | 0.7 /100 | #249 | Tragic 42.1% |
| U.S. Virgin Islanders | 0.7 /100 | #250 | Tragic 42.1% |
| Immigrants | Bahamas | 0.7 /100 | #251 | Tragic 42.1% |
| French American Indians | 0.6 /100 | #252 | Tragic 42.0% |
| Indonesians | 0.6 /100 | #253 | Tragic 41.9% |
| Cubans | 0.6 /100 | #254 | Tragic 41.9% |
| Immigrants | Guyana | 0.5 /100 | #255 | Tragic 41.8% |
| Immigrants | Congo | 0.5 /100 | #256 | Tragic 41.8% |
| Spanish Americans | 0.5 /100 | #257 | Tragic 41.8% |
| Japanese | 0.5 /100 | #258 | Tragic 41.7% |
| Malaysians | 0.4 /100 | #259 | Tragic 41.6% |