Blackfeet vs Afghan Associate's Degree
COMPARE
Blackfeet
Afghan
Associate's Degree
Associate's Degree Comparison
Blackfeet
Afghans
40.3%
ASSOCIATE'S DEGREE
0.1/ 100
METRIC RATING
277th/ 347
METRIC RANK
48.9%
ASSOCIATE'S DEGREE
94.8/ 100
METRIC RATING
117th/ 347
METRIC RANK
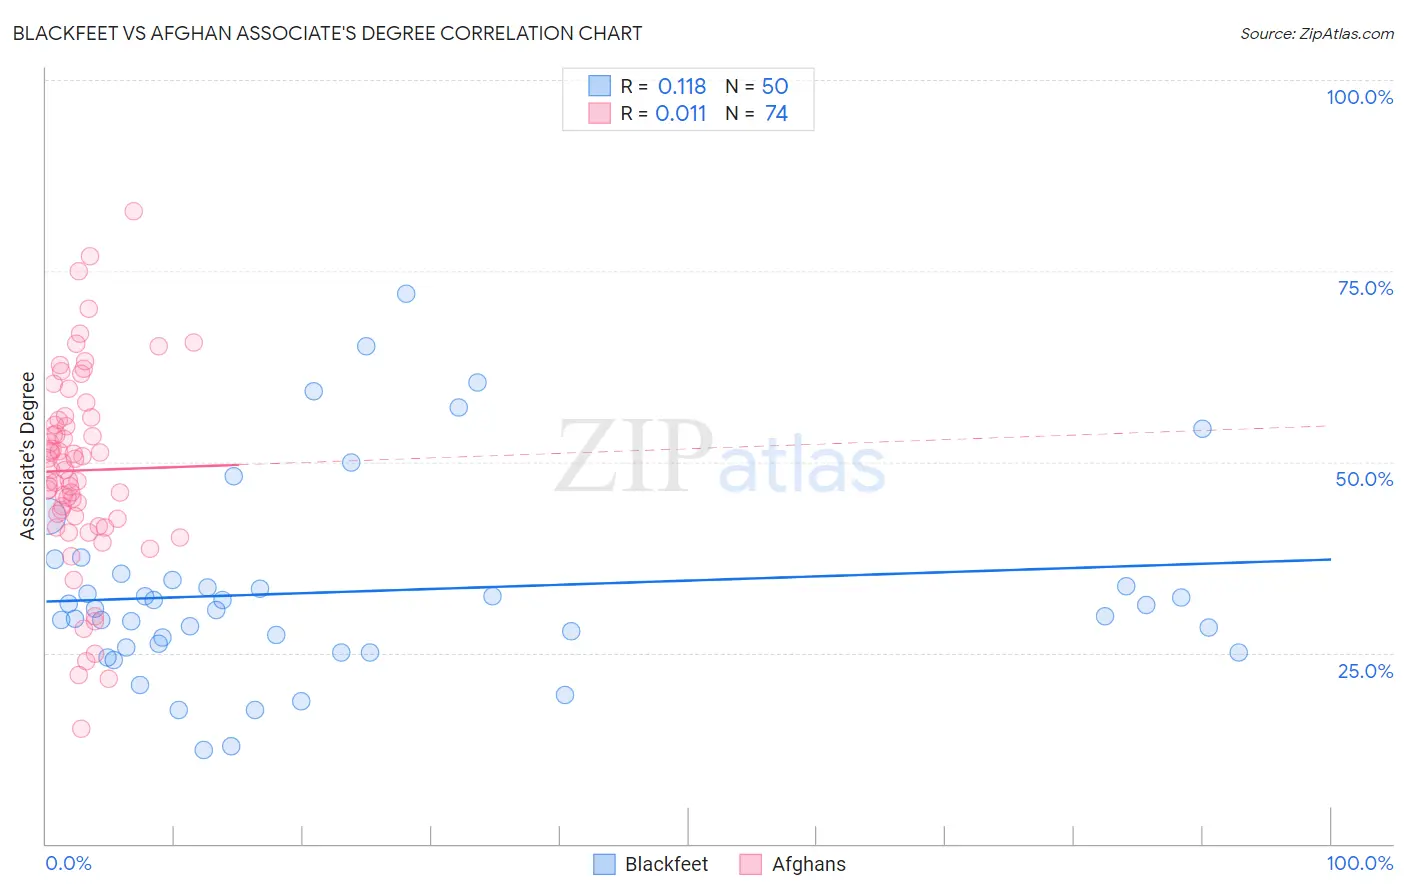
Blackfeet vs Afghan Associate's Degree Correlation Chart
The statistical analysis conducted on geographies consisting of 309,580,719 people shows a poor positive correlation between the proportion of Blackfeet and percentage of population with at least associate's degree education in the United States with a correlation coefficient (R) of 0.118 and weighted average of 40.3%. Similarly, the statistical analysis conducted on geographies consisting of 148,873,892 people shows no correlation between the proportion of Afghans and percentage of population with at least associate's degree education in the United States with a correlation coefficient (R) of 0.011 and weighted average of 48.9%, a difference of 21.2%.
Associate's Degree Correlation Summary
| Measurement | Blackfeet | Afghan |
| Minimum | 12.2% | 15.1% |
| Maximum | 72.0% | 82.8% |
| Range | 59.8% | 67.7% |
| Mean | 33.0% | 48.9% |
| Median | 30.7% | 48.9% |
| Interquartile 25% (IQ1) | 25.7% | 42.6% |
| Interquartile 75% (IQ3) | 34.5% | 55.5% |
| Interquartile Range (IQR) | 8.8% | 12.9% |
| Standard Deviation (Sample) | 13.0% | 12.8% |
| Standard Deviation (Population) | 12.8% | 12.7% |
Similar Demographics by Associate's Degree
Demographics Similar to Blackfeet by Associate's Degree
In terms of associate's degree, the demographic groups most similar to Blackfeet are Puerto Rican (40.4%, a difference of 0.050%), Ottawa (40.3%, a difference of 0.15%), Potawatomi (40.4%, a difference of 0.16%), Immigrants from Nicaragua (40.3%, a difference of 0.19%), and Immigrants from Dominica (40.5%, a difference of 0.30%).
| Demographics | Rating | Rank | Associate's Degree |
| Chippewa | 0.2 /100 | #270 | Tragic 40.7% |
| Immigrants | Laos | 0.1 /100 | #271 | Tragic 40.7% |
| Belizeans | 0.1 /100 | #272 | Tragic 40.6% |
| Puget Sound Salish | 0.1 /100 | #273 | Tragic 40.5% |
| Immigrants | Dominica | 0.1 /100 | #274 | Tragic 40.5% |
| Potawatomi | 0.1 /100 | #275 | Tragic 40.4% |
| Puerto Ricans | 0.1 /100 | #276 | Tragic 40.4% |
| Blackfeet | 0.1 /100 | #277 | Tragic 40.3% |
| Ottawa | 0.1 /100 | #278 | Tragic 40.3% |
| Immigrants | Nicaragua | 0.1 /100 | #279 | Tragic 40.3% |
| Immigrants | Micronesia | 0.1 /100 | #280 | Tragic 40.2% |
| Immigrants | Portugal | 0.1 /100 | #281 | Tragic 40.1% |
| Bangladeshis | 0.1 /100 | #282 | Tragic 40.0% |
| Haitians | 0.1 /100 | #283 | Tragic 40.0% |
| Comanche | 0.1 /100 | #284 | Tragic 39.9% |
Demographics Similar to Afghans by Associate's Degree
In terms of associate's degree, the demographic groups most similar to Afghans are British (48.9%, a difference of 0.040%), Albanian (48.8%, a difference of 0.060%), Lebanese (48.8%, a difference of 0.070%), Alsatian (48.8%, a difference of 0.10%), and Luxembourger (48.9%, a difference of 0.11%).
| Demographics | Rating | Rank | Associate's Degree |
| Austrians | 95.8 /100 | #110 | Exceptional 49.1% |
| Immigrants | Venezuela | 95.8 /100 | #111 | Exceptional 49.1% |
| Immigrants | Chile | 95.3 /100 | #112 | Exceptional 49.0% |
| Palestinians | 95.3 /100 | #113 | Exceptional 49.0% |
| Arabs | 95.3 /100 | #114 | Exceptional 49.0% |
| Luxembourgers | 95.1 /100 | #115 | Exceptional 48.9% |
| British | 95.0 /100 | #116 | Exceptional 48.9% |
| Afghans | 94.8 /100 | #117 | Exceptional 48.9% |
| Albanians | 94.7 /100 | #118 | Exceptional 48.8% |
| Lebanese | 94.6 /100 | #119 | Exceptional 48.8% |
| Alsatians | 94.6 /100 | #120 | Exceptional 48.8% |
| Ugandans | 93.9 /100 | #121 | Exceptional 48.7% |
| Italians | 93.9 /100 | #122 | Exceptional 48.7% |
| Brazilians | 93.7 /100 | #123 | Exceptional 48.7% |
| Serbians | 92.6 /100 | #124 | Exceptional 48.5% |