Bhutanese vs Mexican Unemployment Among Women with Children Under 6 years
COMPARE
Bhutanese
Mexican
Unemployment Among Women with Children Under 6 years
Unemployment Among Women with Children Under 6 years Comparison
Bhutanese
Mexicans
6.7%
UNEMPLOYMENT AMONG WOMEN WITH CHILDREN UNDER 6 YEARS
99.9/ 100
METRIC RATING
43rd/ 347
METRIC RANK
8.9%
UNEMPLOYMENT AMONG WOMEN WITH CHILDREN UNDER 6 YEARS
0.0/ 100
METRIC RATING
297th/ 347
METRIC RANK
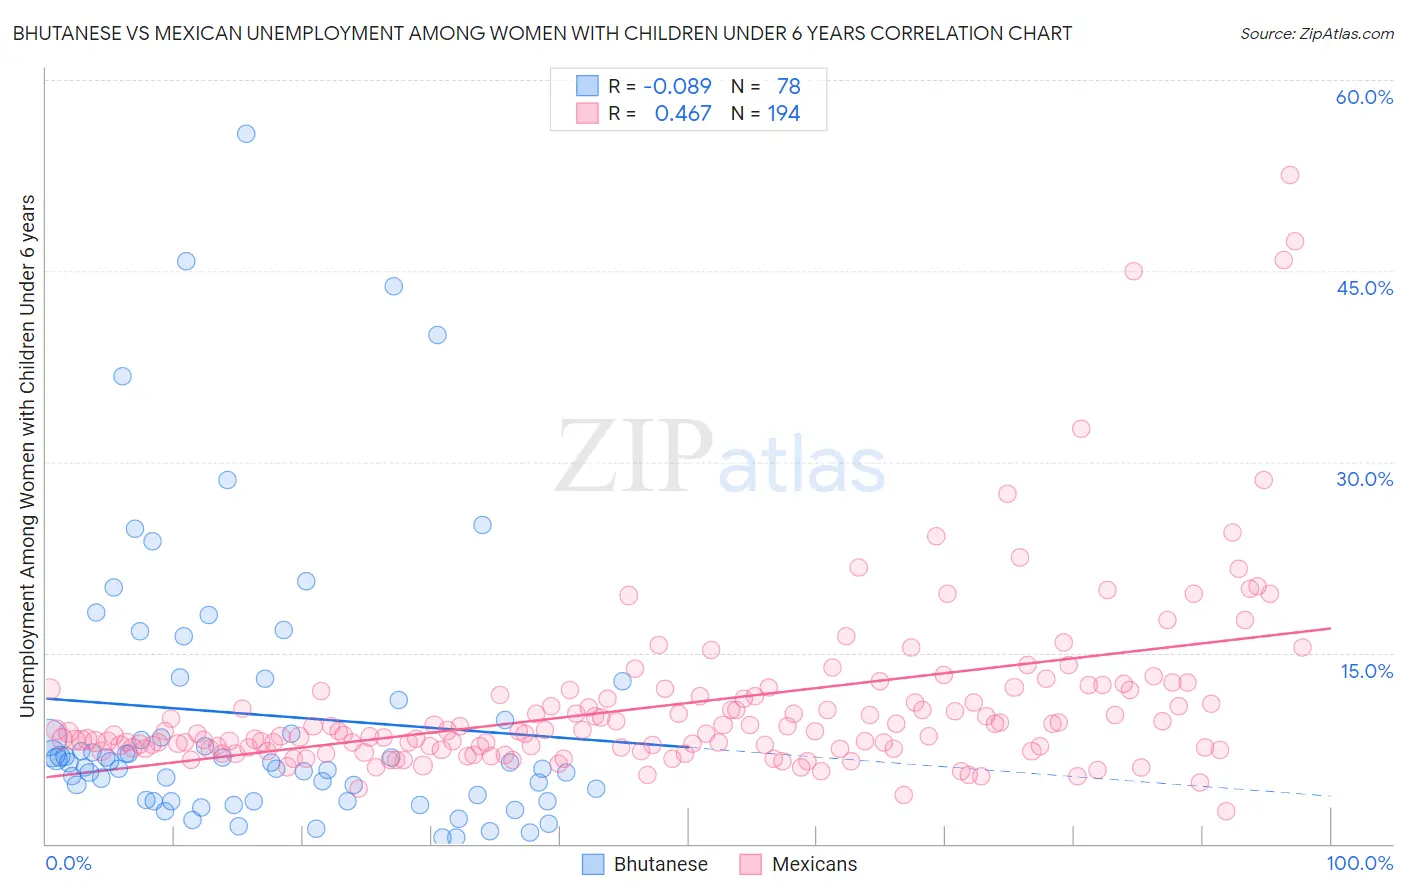
Bhutanese vs Mexican Unemployment Among Women with Children Under 6 years Correlation Chart
The statistical analysis conducted on geographies consisting of 334,834,732 people shows a slight negative correlation between the proportion of Bhutanese and unemployment rate among women with children under the age of 6 in the United States with a correlation coefficient (R) of -0.089 and weighted average of 6.7%. Similarly, the statistical analysis conducted on geographies consisting of 378,149,944 people shows a moderate positive correlation between the proportion of Mexicans and unemployment rate among women with children under the age of 6 in the United States with a correlation coefficient (R) of 0.467 and weighted average of 8.9%, a difference of 32.3%.
Unemployment Among Women with Children Under 6 years Correlation Summary
| Measurement | Bhutanese | Mexican |
| Minimum | 0.50% | 2.6% |
| Maximum | 55.8% | 52.5% |
| Range | 55.3% | 49.9% |
| Mean | 10.1% | 10.9% |
| Median | 6.4% | 8.7% |
| Interquartile 25% (IQ1) | 3.4% | 7.5% |
| Interquartile 75% (IQ3) | 11.3% | 11.6% |
| Interquartile Range (IQR) | 7.9% | 4.1% |
| Standard Deviation (Sample) | 11.0% | 7.1% |
| Standard Deviation (Population) | 11.0% | 7.0% |
Similar Demographics by Unemployment Among Women with Children Under 6 years
Demographics Similar to Bhutanese by Unemployment Among Women with Children Under 6 years
In terms of unemployment among women with children under 6 years, the demographic groups most similar to Bhutanese are Immigrants from Cuba (6.7%, a difference of 0.28%), Immigrants from Indonesia (6.7%, a difference of 0.38%), Asian (6.7%, a difference of 0.54%), Iranian (6.7%, a difference of 0.55%), and Immigrants from Australia (6.8%, a difference of 0.61%).
| Demographics | Rating | Rank | Unemployment Among Women with Children Under 6 years |
| Luxembourgers | 100.0 /100 | #36 | Exceptional 6.6% |
| Sri Lankans | 100.0 /100 | #37 | Exceptional 6.6% |
| Hmong | 100.0 /100 | #38 | Exceptional 6.7% |
| Immigrants | Russia | 100.0 /100 | #39 | Exceptional 6.7% |
| Asians | 100.0 /100 | #40 | Exceptional 6.7% |
| Immigrants | Indonesia | 99.9 /100 | #41 | Exceptional 6.7% |
| Immigrants | Cuba | 99.9 /100 | #42 | Exceptional 6.7% |
| Bhutanese | 99.9 /100 | #43 | Exceptional 6.7% |
| Iranians | 99.9 /100 | #44 | Exceptional 6.7% |
| Immigrants | Australia | 99.9 /100 | #45 | Exceptional 6.8% |
| Latvians | 99.9 /100 | #46 | Exceptional 6.8% |
| Immigrants | Asia | 99.9 /100 | #47 | Exceptional 6.8% |
| Immigrants | Switzerland | 99.9 /100 | #48 | Exceptional 6.8% |
| Immigrants | Nepal | 99.9 /100 | #49 | Exceptional 6.8% |
| Immigrants | Ireland | 99.9 /100 | #50 | Exceptional 6.8% |
Demographics Similar to Mexicans by Unemployment Among Women with Children Under 6 years
In terms of unemployment among women with children under 6 years, the demographic groups most similar to Mexicans are Immigrants from Dominican Republic (8.9%, a difference of 0.10%), Tlingit-Haida (8.9%, a difference of 0.16%), Immigrants from Central America (8.9%, a difference of 0.23%), Nonimmigrants (8.8%, a difference of 0.27%), and Immigrants from Jamaica (8.9%, a difference of 0.37%).
| Demographics | Rating | Rank | Unemployment Among Women with Children Under 6 years |
| Vietnamese | 0.0 /100 | #290 | Tragic 8.8% |
| Jamaicans | 0.0 /100 | #291 | Tragic 8.8% |
| Cheyenne | 0.0 /100 | #292 | Tragic 8.8% |
| Immigrants | Bangladesh | 0.0 /100 | #293 | Tragic 8.8% |
| Immigrants | Nonimmigrants | 0.0 /100 | #294 | Tragic 8.8% |
| Immigrants | Central America | 0.0 /100 | #295 | Tragic 8.9% |
| Immigrants | Dominican Republic | 0.0 /100 | #296 | Tragic 8.9% |
| Mexicans | 0.0 /100 | #297 | Tragic 8.9% |
| Tlingit-Haida | 0.0 /100 | #298 | Tragic 8.9% |
| Immigrants | Jamaica | 0.0 /100 | #299 | Tragic 8.9% |
| Creek | 0.0 /100 | #300 | Tragic 8.9% |
| Chickasaw | 0.0 /100 | #301 | Tragic 9.0% |
| Hispanics or Latinos | 0.0 /100 | #302 | Tragic 9.0% |
| Immigrants | West Indies | 0.0 /100 | #303 | Tragic 9.0% |
| Immigrants | Mexico | 0.0 /100 | #304 | Tragic 9.1% |