Kiowa vs Immigrants from Western Africa College, 1 year or more
COMPARE
Kiowa
Immigrants from Western Africa
College, 1 year or more
College, 1 year or more Comparison
Kiowa
Immigrants from Western Africa
51.0%
COLLEGE, 1 YEAR OR MORE
0.0/ 100
METRIC RATING
320th/ 347
METRIC RANK
57.0%
COLLEGE, 1 YEAR OR MORE
4.6/ 100
METRIC RATING
226th/ 347
METRIC RANK
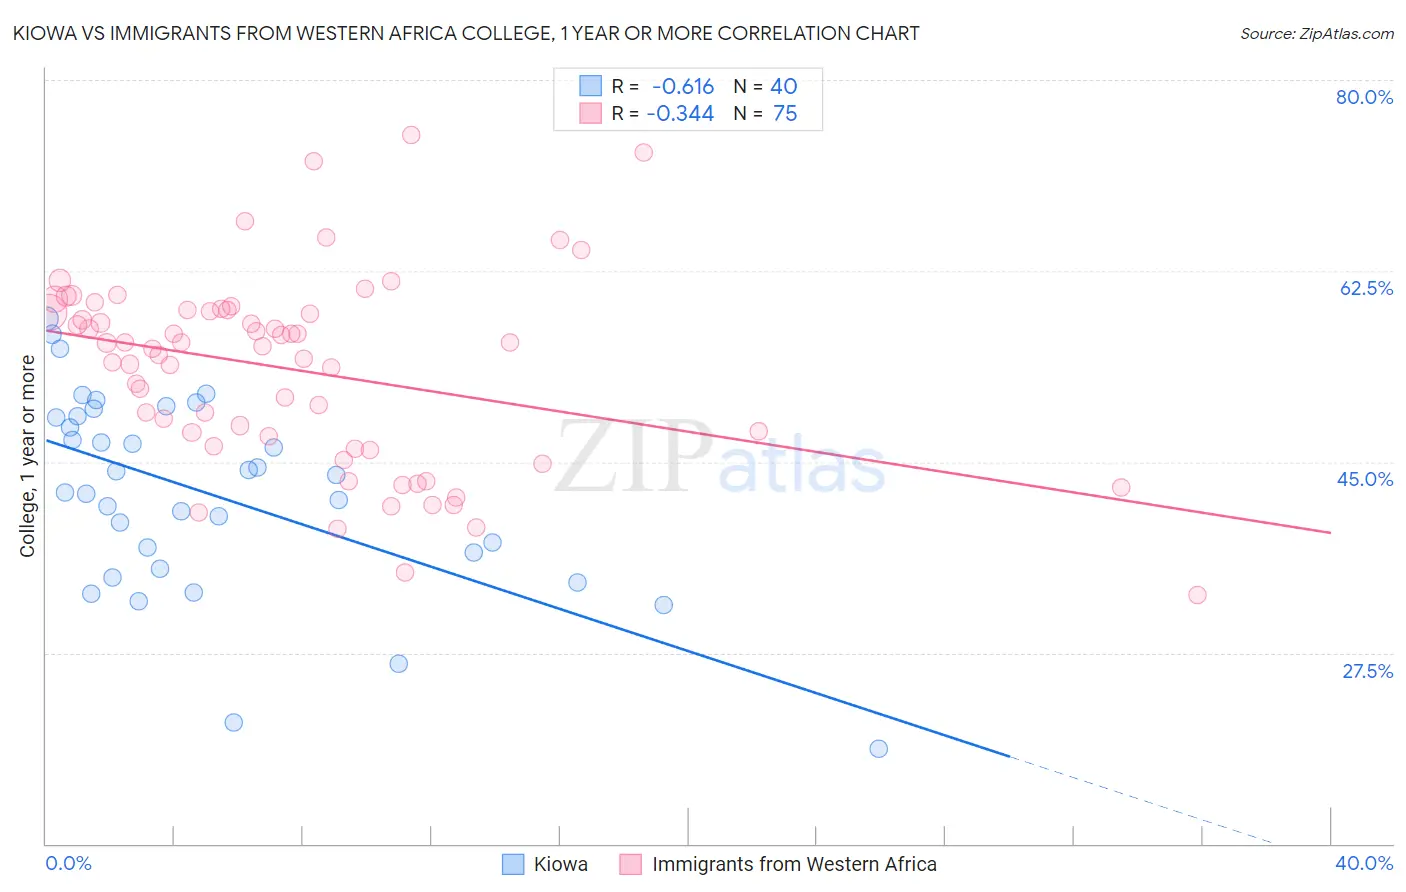
Kiowa vs Immigrants from Western Africa College, 1 year or more Correlation Chart
The statistical analysis conducted on geographies consisting of 56,101,444 people shows a significant negative correlation between the proportion of Kiowa and percentage of population with at least college, 1 year or more education in the United States with a correlation coefficient (R) of -0.616 and weighted average of 51.0%. Similarly, the statistical analysis conducted on geographies consisting of 357,885,062 people shows a mild negative correlation between the proportion of Immigrants from Western Africa and percentage of population with at least college, 1 year or more education in the United States with a correlation coefficient (R) of -0.344 and weighted average of 57.0%, a difference of 11.9%.
College, 1 year or more Correlation Summary
| Measurement | Kiowa | Immigrants from Western Africa |
| Minimum | 18.8% | 32.8% |
| Maximum | 58.1% | 75.0% |
| Range | 39.3% | 42.2% |
| Mean | 42.0% | 53.4% |
| Median | 43.0% | 55.6% |
| Interquartile 25% (IQ1) | 35.9% | 46.4% |
| Interquartile 75% (IQ3) | 49.1% | 58.9% |
| Interquartile Range (IQR) | 13.2% | 12.5% |
| Standard Deviation (Sample) | 9.0% | 8.7% |
| Standard Deviation (Population) | 8.9% | 8.7% |
Similar Demographics by College, 1 year or more
Demographics Similar to Kiowa by College, 1 year or more
In terms of college, 1 year or more, the demographic groups most similar to Kiowa are Immigrants from El Salvador (51.0%, a difference of 0.060%), Hopi (50.9%, a difference of 0.12%), Immigrants from Honduras (51.0%, a difference of 0.15%), Hispanic or Latino (51.1%, a difference of 0.28%), and Navajo (50.8%, a difference of 0.31%).
| Demographics | Rating | Rank | College, 1 year or more |
| Immigrants | Caribbean | 0.0 /100 | #313 | Tragic 51.4% |
| Fijians | 0.0 /100 | #314 | Tragic 51.3% |
| Guatemalans | 0.0 /100 | #315 | Tragic 51.2% |
| Cajuns | 0.0 /100 | #316 | Tragic 51.2% |
| Hispanics or Latinos | 0.0 /100 | #317 | Tragic 51.1% |
| Immigrants | Honduras | 0.0 /100 | #318 | Tragic 51.0% |
| Immigrants | El Salvador | 0.0 /100 | #319 | Tragic 51.0% |
| Kiowa | 0.0 /100 | #320 | Tragic 51.0% |
| Hopi | 0.0 /100 | #321 | Tragic 50.9% |
| Navajo | 0.0 /100 | #322 | Tragic 50.8% |
| Immigrants | Guatemala | 0.0 /100 | #323 | Tragic 50.7% |
| Immigrants | Cuba | 0.0 /100 | #324 | Tragic 50.7% |
| Immigrants | Latin America | 0.0 /100 | #325 | Tragic 50.7% |
| Dominicans | 0.0 /100 | #326 | Tragic 50.6% |
| Menominee | 0.0 /100 | #327 | Tragic 50.6% |
Demographics Similar to Immigrants from Western Africa by College, 1 year or more
In terms of college, 1 year or more, the demographic groups most similar to Immigrants from Western Africa are Vietnamese (57.0%, a difference of 0.030%), Immigrants (57.0%, a difference of 0.070%), Immigrants from Fiji (56.9%, a difference of 0.21%), Portuguese (57.2%, a difference of 0.23%), and Hmong (57.2%, a difference of 0.23%).
| Demographics | Rating | Rank | College, 1 year or more |
| Whites/Caucasians | 8.7 /100 | #219 | Tragic 57.6% |
| Immigrants | Costa Rica | 8.0 /100 | #220 | Tragic 57.5% |
| Immigrants | Ghana | 7.7 /100 | #221 | Tragic 57.4% |
| Sub-Saharan Africans | 6.1 /100 | #222 | Tragic 57.3% |
| Portuguese | 5.4 /100 | #223 | Tragic 57.2% |
| Hmong | 5.4 /100 | #224 | Tragic 57.2% |
| Vietnamese | 4.7 /100 | #225 | Tragic 57.0% |
| Immigrants | Western Africa | 4.6 /100 | #226 | Tragic 57.0% |
| Immigrants | Immigrants | 4.4 /100 | #227 | Tragic 57.0% |
| Immigrants | Fiji | 4.0 /100 | #228 | Tragic 56.9% |
| Cree | 3.6 /100 | #229 | Tragic 56.8% |
| Liberians | 3.1 /100 | #230 | Tragic 56.7% |
| Immigrants | Burma/Myanmar | 2.7 /100 | #231 | Tragic 56.6% |
| Immigrants | Bangladesh | 2.6 /100 | #232 | Tragic 56.6% |
| Immigrants | Nonimmigrants | 2.5 /100 | #233 | Tragic 56.5% |