Belizean vs Costa Rican 7th Grade
COMPARE
Belizean
Costa Rican
7th Grade
7th Grade Comparison
Belizeans
Costa Ricans
93.5%
7TH GRADE
0.0/ 100
METRIC RATING
321st/ 347
METRIC RANK
95.5%
7TH GRADE
3.3/ 100
METRIC RATING
232nd/ 347
METRIC RANK
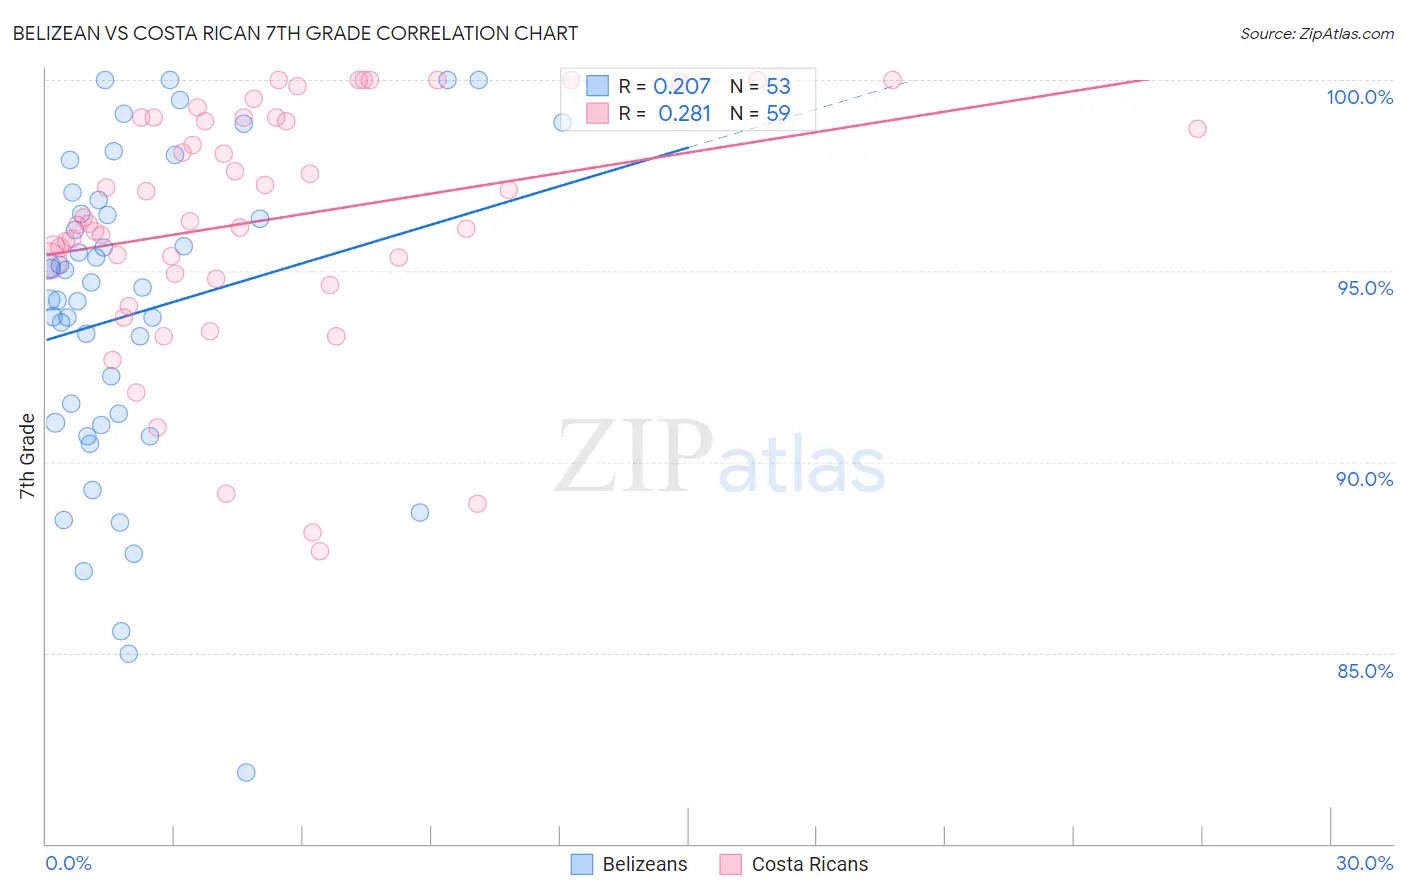
Belizean vs Costa Rican 7th Grade Correlation Chart
The statistical analysis conducted on geographies consisting of 144,138,333 people shows a weak positive correlation between the proportion of Belizeans and percentage of population with at least 7th grade education in the United States with a correlation coefficient (R) of 0.207 and weighted average of 93.5%. Similarly, the statistical analysis conducted on geographies consisting of 253,601,897 people shows a weak positive correlation between the proportion of Costa Ricans and percentage of population with at least 7th grade education in the United States with a correlation coefficient (R) of 0.281 and weighted average of 95.5%, a difference of 2.2%.
7th Grade Correlation Summary
| Measurement | Belizean | Costa Rican |
| Minimum | 81.9% | 87.6% |
| Maximum | 100.0% | 100.0% |
| Range | 18.1% | 12.4% |
| Mean | 93.9% | 96.3% |
| Median | 94.6% | 96.3% |
| Interquartile 25% (IQ1) | 91.0% | 94.9% |
| Interquartile 75% (IQ3) | 96.7% | 99.0% |
| Interquartile Range (IQR) | 5.7% | 4.1% |
| Standard Deviation (Sample) | 4.2% | 3.2% |
| Standard Deviation (Population) | 4.2% | 3.1% |
Similar Demographics by 7th Grade
Demographics Similar to Belizeans by 7th Grade
In terms of 7th grade, the demographic groups most similar to Belizeans are Immigrants from Fiji (93.5%, a difference of 0.040%), Nicaraguan (93.5%, a difference of 0.040%), Immigrants from Belize (93.4%, a difference of 0.15%), Dominican (93.3%, a difference of 0.16%), and Immigrants from Cambodia (93.7%, a difference of 0.21%).
| Demographics | Rating | Rank | 7th Grade |
| Japanese | 0.0 /100 | #314 | Tragic 94.0% |
| Vietnamese | 0.0 /100 | #315 | Tragic 93.9% |
| Immigrants | Vietnam | 0.0 /100 | #316 | Tragic 93.9% |
| Immigrants | Cuba | 0.0 /100 | #317 | Tragic 93.8% |
| Immigrants | Ecuador | 0.0 /100 | #318 | Tragic 93.7% |
| Immigrants | Cambodia | 0.0 /100 | #319 | Tragic 93.7% |
| Immigrants | Fiji | 0.0 /100 | #320 | Tragic 93.5% |
| Belizeans | 0.0 /100 | #321 | Tragic 93.5% |
| Nicaraguans | 0.0 /100 | #322 | Tragic 93.5% |
| Immigrants | Belize | 0.0 /100 | #323 | Tragic 93.4% |
| Dominicans | 0.0 /100 | #324 | Tragic 93.3% |
| Central American Indians | 0.0 /100 | #325 | Tragic 93.3% |
| Nepalese | 0.0 /100 | #326 | Tragic 93.2% |
| Immigrants | Cabo Verde | 0.0 /100 | #327 | Tragic 93.1% |
| Immigrants | Nicaragua | 0.0 /100 | #328 | Tragic 93.0% |
Demographics Similar to Costa Ricans by 7th Grade
In terms of 7th grade, the demographic groups most similar to Costa Ricans are Immigrants from Indonesia (95.5%, a difference of 0.0%), Nigerian (95.5%, a difference of 0.020%), Senegalese (95.6%, a difference of 0.030%), Immigrants from Africa (95.5%, a difference of 0.030%), and Native/Alaskan (95.6%, a difference of 0.040%).
| Demographics | Rating | Rank | 7th Grade |
| Immigrants | Malaysia | 6.2 /100 | #225 | Tragic 95.6% |
| Immigrants | Eastern Asia | 5.8 /100 | #226 | Tragic 95.6% |
| Immigrants | Western Asia | 5.4 /100 | #227 | Tragic 95.6% |
| Immigrants | Eastern Africa | 5.1 /100 | #228 | Tragic 95.6% |
| Immigrants | Panama | 4.9 /100 | #229 | Tragic 95.6% |
| Natives/Alaskans | 4.2 /100 | #230 | Tragic 95.6% |
| Senegalese | 4.0 /100 | #231 | Tragic 95.6% |
| Costa Ricans | 3.3 /100 | #232 | Tragic 95.5% |
| Immigrants | Indonesia | 3.3 /100 | #233 | Tragic 95.5% |
| Nigerians | 3.0 /100 | #234 | Tragic 95.5% |
| Immigrants | Africa | 2.7 /100 | #235 | Tragic 95.5% |
| Asians | 2.6 /100 | #236 | Tragic 95.5% |
| Immigrants | Asia | 2.3 /100 | #237 | Tragic 95.5% |
| Indians (Asian) | 2.3 /100 | #238 | Tragic 95.5% |
| Jamaicans | 2.2 /100 | #239 | Tragic 95.5% |