Armenian vs Immigrants from Saudi Arabia Professional Degree
COMPARE
Armenian
Immigrants from Saudi Arabia
Professional Degree
Professional Degree Comparison
Armenians
Immigrants from Saudi Arabia
5.3%
PROFESSIONAL DEGREE
99.7/ 100
METRIC RATING
78th/ 347
METRIC RANK
5.9%
PROFESSIONAL DEGREE
100.0/ 100
METRIC RATING
43rd/ 347
METRIC RANK
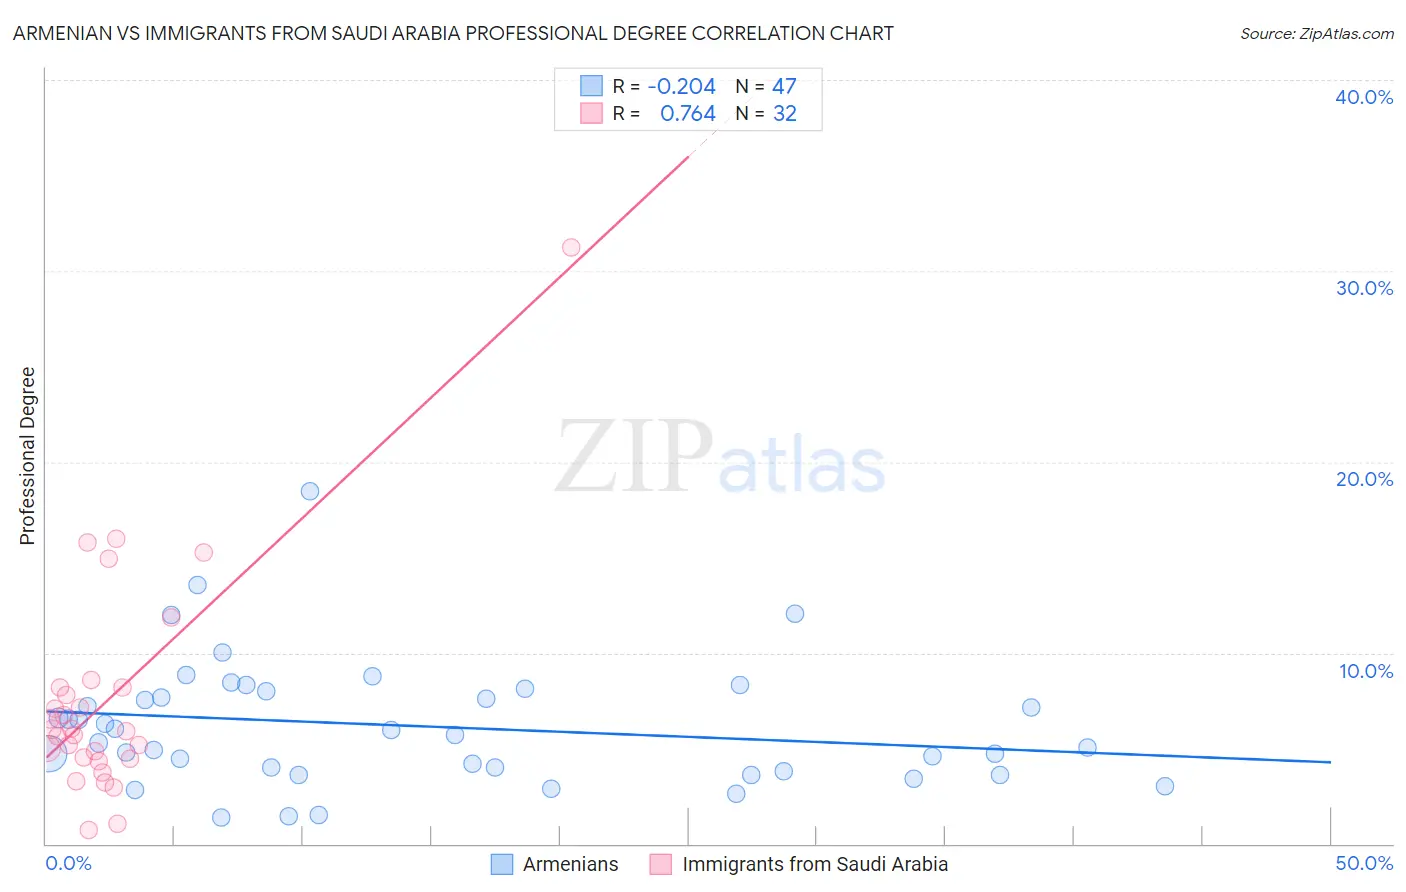
Armenian vs Immigrants from Saudi Arabia Professional Degree Correlation Chart
The statistical analysis conducted on geographies consisting of 310,624,629 people shows a weak negative correlation between the proportion of Armenians and percentage of population with at least professional degree education in the United States with a correlation coefficient (R) of -0.204 and weighted average of 5.3%. Similarly, the statistical analysis conducted on geographies consisting of 164,208,779 people shows a strong positive correlation between the proportion of Immigrants from Saudi Arabia and percentage of population with at least professional degree education in the United States with a correlation coefficient (R) of 0.764 and weighted average of 5.9%, a difference of 11.2%.
Professional Degree Correlation Summary
| Measurement | Armenian | Immigrants from Saudi Arabia |
| Minimum | 1.4% | 0.70% |
| Maximum | 18.5% | 31.2% |
| Range | 17.1% | 30.5% |
| Mean | 6.2% | 7.6% |
| Median | 5.7% | 5.9% |
| Interquartile 25% (IQ1) | 3.8% | 4.5% |
| Interquartile 75% (IQ3) | 8.0% | 8.2% |
| Interquartile Range (IQR) | 4.1% | 3.7% |
| Standard Deviation (Sample) | 3.3% | 5.9% |
| Standard Deviation (Population) | 3.3% | 5.8% |
Similar Demographics by Professional Degree
Demographics Similar to Armenians by Professional Degree
In terms of professional degree, the demographic groups most similar to Armenians are Immigrants from Ethiopia (5.3%, a difference of 0.050%), Immigrants from Canada (5.3%, a difference of 0.090%), Immigrants from Indonesia (5.3%, a difference of 0.17%), Immigrants from North America (5.3%, a difference of 0.17%), and Ethiopian (5.4%, a difference of 0.30%).
| Demographics | Rating | Rank | Professional Degree |
| Immigrants | Western Asia | 99.8 /100 | #71 | Exceptional 5.4% |
| Lithuanians | 99.8 /100 | #72 | Exceptional 5.4% |
| Immigrants | Romania | 99.8 /100 | #73 | Exceptional 5.4% |
| Ethiopians | 99.7 /100 | #74 | Exceptional 5.4% |
| Immigrants | Indonesia | 99.7 /100 | #75 | Exceptional 5.3% |
| Immigrants | Canada | 99.7 /100 | #76 | Exceptional 5.3% |
| Immigrants | Ethiopia | 99.7 /100 | #77 | Exceptional 5.3% |
| Armenians | 99.7 /100 | #78 | Exceptional 5.3% |
| Immigrants | North America | 99.7 /100 | #79 | Exceptional 5.3% |
| Immigrants | England | 99.6 /100 | #80 | Exceptional 5.3% |
| Immigrants | Brazil | 99.6 /100 | #81 | Exceptional 5.3% |
| Romanians | 99.6 /100 | #82 | Exceptional 5.3% |
| Carpatho Rusyns | 99.6 /100 | #83 | Exceptional 5.3% |
| Immigrants | Croatia | 99.6 /100 | #84 | Exceptional 5.3% |
| Immigrants | Zimbabwe | 99.6 /100 | #85 | Exceptional 5.3% |
Demographics Similar to Immigrants from Saudi Arabia by Professional Degree
In terms of professional degree, the demographic groups most similar to Immigrants from Saudi Arabia are Argentinean (5.9%, a difference of 0.16%), Estonian (6.0%, a difference of 0.32%), New Zealander (6.0%, a difference of 0.33%), Cambodian (6.0%, a difference of 0.52%), and Immigrants from South Central Asia (5.9%, a difference of 0.61%).
| Demographics | Rating | Rank | Professional Degree |
| Immigrants | Russia | 100.0 /100 | #36 | Exceptional 6.0% |
| Immigrants | Austria | 100.0 /100 | #37 | Exceptional 6.0% |
| Immigrants | Norway | 100.0 /100 | #38 | Exceptional 6.0% |
| Immigrants | South Africa | 100.0 /100 | #39 | Exceptional 6.0% |
| Cambodians | 100.0 /100 | #40 | Exceptional 6.0% |
| New Zealanders | 100.0 /100 | #41 | Exceptional 6.0% |
| Estonians | 100.0 /100 | #42 | Exceptional 6.0% |
| Immigrants | Saudi Arabia | 100.0 /100 | #43 | Exceptional 5.9% |
| Argentineans | 100.0 /100 | #44 | Exceptional 5.9% |
| Immigrants | South Central Asia | 100.0 /100 | #45 | Exceptional 5.9% |
| Immigrants | Argentina | 100.0 /100 | #46 | Exceptional 5.9% |
| Australians | 100.0 /100 | #47 | Exceptional 5.9% |
| Paraguayans | 100.0 /100 | #48 | Exceptional 5.9% |
| Immigrants | Latvia | 100.0 /100 | #49 | Exceptional 5.8% |
| Immigrants | Czechoslovakia | 100.0 /100 | #50 | Exceptional 5.8% |