Belizean vs Immigrants from Saudi Arabia Unemployment Among Women with Children Under 18 years
COMPARE
Belizean
Immigrants from Saudi Arabia
Unemployment Among Women with Children Under 18 years
Unemployment Among Women with Children Under 18 years Comparison
Belizeans
Immigrants from Saudi Arabia
6.5%
UNEMPLOYMENT AMONG WOMEN WITH CHILDREN UNDER 18 YEARS
0.0/ 100
METRIC RATING
307th/ 347
METRIC RANK
5.4%
UNEMPLOYMENT AMONG WOMEN WITH CHILDREN UNDER 18 YEARS
65.0/ 100
METRIC RATING
162nd/ 347
METRIC RANK
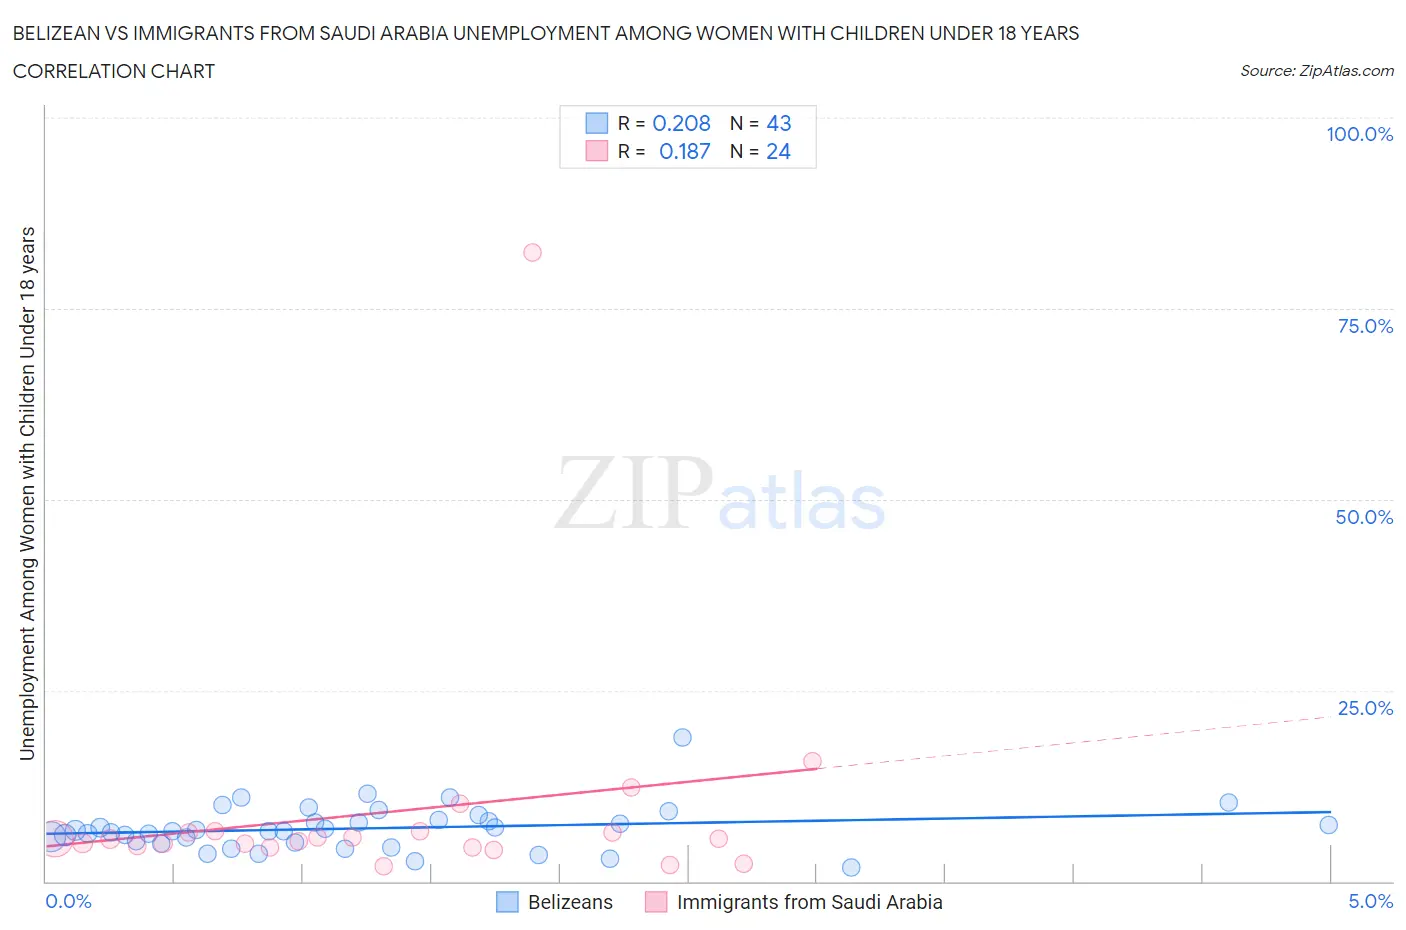
Belizean vs Immigrants from Saudi Arabia Unemployment Among Women with Children Under 18 years Correlation Chart
The statistical analysis conducted on geographies consisting of 142,666,018 people shows a weak positive correlation between the proportion of Belizeans and unemployment rate among women with children under the age of 18 in the United States with a correlation coefficient (R) of 0.208 and weighted average of 6.5%. Similarly, the statistical analysis conducted on geographies consisting of 162,263,235 people shows a poor positive correlation between the proportion of Immigrants from Saudi Arabia and unemployment rate among women with children under the age of 18 in the United States with a correlation coefficient (R) of 0.187 and weighted average of 5.4%, a difference of 21.1%.
Unemployment Among Women with Children Under 18 years Correlation Summary
| Measurement | Belizean | Immigrants from Saudi Arabia |
| Minimum | 1.8% | 1.9% |
| Maximum | 18.8% | 82.4% |
| Range | 17.0% | 80.5% |
| Mean | 6.9% | 9.1% |
| Median | 6.6% | 5.5% |
| Interquartile 25% (IQ1) | 5.0% | 4.5% |
| Interquartile 75% (IQ3) | 8.0% | 6.5% |
| Interquartile Range (IQR) | 3.0% | 1.9% |
| Standard Deviation (Sample) | 3.0% | 15.9% |
| Standard Deviation (Population) | 2.9% | 15.6% |
Similar Demographics by Unemployment Among Women with Children Under 18 years
Demographics Similar to Belizeans by Unemployment Among Women with Children Under 18 years
In terms of unemployment among women with children under 18 years, the demographic groups most similar to Belizeans are Immigrants from Guyana (6.5%, a difference of 0.070%), Immigrants from Central America (6.5%, a difference of 0.12%), African (6.5%, a difference of 0.22%), Ecuadorian (6.5%, a difference of 0.31%), and Guyanese (6.6%, a difference of 0.55%).
| Demographics | Rating | Rank | Unemployment Among Women with Children Under 18 years |
| Immigrants | Jamaica | 0.0 /100 | #300 | Tragic 6.4% |
| Immigrants | Haiti | 0.0 /100 | #301 | Tragic 6.4% |
| Immigrants | Armenia | 0.0 /100 | #302 | Tragic 6.5% |
| Immigrants | Honduras | 0.0 /100 | #303 | Tragic 6.5% |
| Vietnamese | 0.0 /100 | #304 | Tragic 6.5% |
| Immigrants | Central America | 0.0 /100 | #305 | Tragic 6.5% |
| Immigrants | Guyana | 0.0 /100 | #306 | Tragic 6.5% |
| Belizeans | 0.0 /100 | #307 | Tragic 6.5% |
| Africans | 0.0 /100 | #308 | Tragic 6.5% |
| Ecuadorians | 0.0 /100 | #309 | Tragic 6.5% |
| Guyanese | 0.0 /100 | #310 | Tragic 6.6% |
| Yaqui | 0.0 /100 | #311 | Tragic 6.6% |
| Immigrants | Mexico | 0.0 /100 | #312 | Tragic 6.6% |
| Hispanics or Latinos | 0.0 /100 | #313 | Tragic 6.6% |
| British West Indians | 0.0 /100 | #314 | Tragic 6.6% |
Demographics Similar to Immigrants from Saudi Arabia by Unemployment Among Women with Children Under 18 years
In terms of unemployment among women with children under 18 years, the demographic groups most similar to Immigrants from Saudi Arabia are Lebanese (5.4%, a difference of 0.030%), Immigrants from Iraq (5.4%, a difference of 0.070%), Afghan (5.4%, a difference of 0.12%), Celtic (5.4%, a difference of 0.16%), and Tlingit-Haida (5.4%, a difference of 0.24%).
| Demographics | Rating | Rank | Unemployment Among Women with Children Under 18 years |
| Koreans | 70.5 /100 | #155 | Good 5.4% |
| South Africans | 70.3 /100 | #156 | Good 5.4% |
| German Russians | 70.2 /100 | #157 | Good 5.4% |
| Immigrants | Burma/Myanmar | 69.5 /100 | #158 | Good 5.4% |
| Chickasaw | 68.4 /100 | #159 | Good 5.4% |
| Afghans | 66.6 /100 | #160 | Good 5.4% |
| Immigrants | Iraq | 65.9 /100 | #161 | Good 5.4% |
| Immigrants | Saudi Arabia | 65.0 /100 | #162 | Good 5.4% |
| Lebanese | 64.7 /100 | #163 | Good 5.4% |
| Celtics | 63.0 /100 | #164 | Good 5.4% |
| Tlingit-Haida | 61.9 /100 | #165 | Good 5.4% |
| Aleuts | 59.4 /100 | #166 | Average 5.4% |
| Immigrants | Denmark | 58.0 /100 | #167 | Average 5.4% |
| Immigrants | Northern Africa | 56.1 /100 | #168 | Average 5.4% |
| Immigrants | Thailand | 55.3 /100 | #169 | Average 5.4% |