French Canadian vs Immigrants from Saudi Arabia Professional Degree
COMPARE
French Canadian
Immigrants from Saudi Arabia
Professional Degree
Professional Degree Comparison
French Canadians
Immigrants from Saudi Arabia
4.0%
PROFESSIONAL DEGREE
8.0/ 100
METRIC RATING
221st/ 347
METRIC RANK
5.9%
PROFESSIONAL DEGREE
100.0/ 100
METRIC RATING
43rd/ 347
METRIC RANK
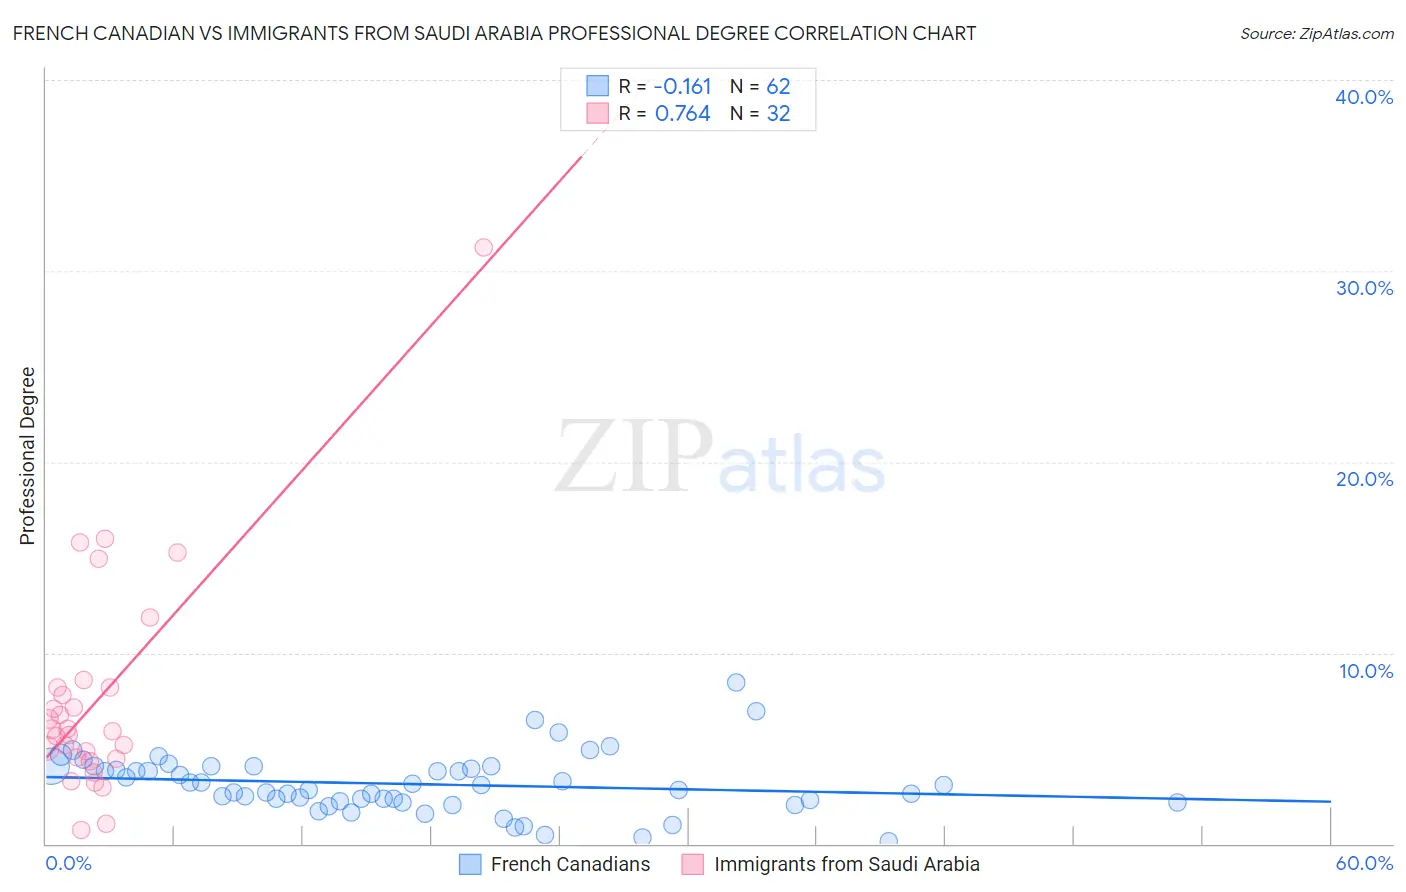
French Canadian vs Immigrants from Saudi Arabia Professional Degree Correlation Chart
The statistical analysis conducted on geographies consisting of 499,387,029 people shows a poor negative correlation between the proportion of French Canadians and percentage of population with at least professional degree education in the United States with a correlation coefficient (R) of -0.161 and weighted average of 4.0%. Similarly, the statistical analysis conducted on geographies consisting of 164,208,779 people shows a strong positive correlation between the proportion of Immigrants from Saudi Arabia and percentage of population with at least professional degree education in the United States with a correlation coefficient (R) of 0.764 and weighted average of 5.9%, a difference of 47.8%.
Professional Degree Correlation Summary
| Measurement | French Canadian | Immigrants from Saudi Arabia |
| Minimum | 0.11% | 0.70% |
| Maximum | 8.5% | 31.2% |
| Range | 8.4% | 30.5% |
| Mean | 3.1% | 7.6% |
| Median | 3.0% | 5.9% |
| Interquartile 25% (IQ1) | 2.2% | 4.5% |
| Interquartile 75% (IQ3) | 4.0% | 8.2% |
| Interquartile Range (IQR) | 1.8% | 3.7% |
| Standard Deviation (Sample) | 1.6% | 5.9% |
| Standard Deviation (Population) | 1.5% | 5.8% |
Similar Demographics by Professional Degree
Demographics Similar to French Canadians by Professional Degree
In terms of professional degree, the demographic groups most similar to French Canadians are Ute (4.0%, a difference of 0.13%), Immigrants from Western Africa (4.0%, a difference of 0.25%), Immigrants from Bosnia and Herzegovina (4.0%, a difference of 0.33%), Trinidadian and Tobagonian (4.0%, a difference of 0.47%), and Immigrants from South Eastern Asia (4.0%, a difference of 0.49%).
| Demographics | Rating | Rank | Professional Degree |
| Immigrants | Ghana | 10.6 /100 | #214 | Poor 4.1% |
| Portuguese | 10.5 /100 | #215 | Poor 4.1% |
| West Indians | 9.8 /100 | #216 | Tragic 4.1% |
| Immigrants | Vietnam | 9.4 /100 | #217 | Tragic 4.0% |
| Dutch | 9.0 /100 | #218 | Tragic 4.0% |
| Immigrants | South Eastern Asia | 8.9 /100 | #219 | Tragic 4.0% |
| Ute | 8.2 /100 | #220 | Tragic 4.0% |
| French Canadians | 8.0 /100 | #221 | Tragic 4.0% |
| Immigrants | Western Africa | 7.5 /100 | #222 | Tragic 4.0% |
| Immigrants | Bosnia and Herzegovina | 7.4 /100 | #223 | Tragic 4.0% |
| Trinidadians and Tobagonians | 7.1 /100 | #224 | Tragic 4.0% |
| Tlingit-Haida | 6.9 /100 | #225 | Tragic 4.0% |
| German Russians | 6.1 /100 | #226 | Tragic 4.0% |
| Cubans | 5.9 /100 | #227 | Tragic 4.0% |
| Immigrants | West Indies | 5.6 /100 | #228 | Tragic 4.0% |
Demographics Similar to Immigrants from Saudi Arabia by Professional Degree
In terms of professional degree, the demographic groups most similar to Immigrants from Saudi Arabia are Argentinean (5.9%, a difference of 0.16%), Estonian (6.0%, a difference of 0.32%), New Zealander (6.0%, a difference of 0.33%), Cambodian (6.0%, a difference of 0.52%), and Immigrants from South Central Asia (5.9%, a difference of 0.61%).
| Demographics | Rating | Rank | Professional Degree |
| Immigrants | Russia | 100.0 /100 | #36 | Exceptional 6.0% |
| Immigrants | Austria | 100.0 /100 | #37 | Exceptional 6.0% |
| Immigrants | Norway | 100.0 /100 | #38 | Exceptional 6.0% |
| Immigrants | South Africa | 100.0 /100 | #39 | Exceptional 6.0% |
| Cambodians | 100.0 /100 | #40 | Exceptional 6.0% |
| New Zealanders | 100.0 /100 | #41 | Exceptional 6.0% |
| Estonians | 100.0 /100 | #42 | Exceptional 6.0% |
| Immigrants | Saudi Arabia | 100.0 /100 | #43 | Exceptional 5.9% |
| Argentineans | 100.0 /100 | #44 | Exceptional 5.9% |
| Immigrants | South Central Asia | 100.0 /100 | #45 | Exceptional 5.9% |
| Immigrants | Argentina | 100.0 /100 | #46 | Exceptional 5.9% |
| Australians | 100.0 /100 | #47 | Exceptional 5.9% |
| Paraguayans | 100.0 /100 | #48 | Exceptional 5.9% |
| Immigrants | Latvia | 100.0 /100 | #49 | Exceptional 5.8% |
| Immigrants | Czechoslovakia | 100.0 /100 | #50 | Exceptional 5.8% |