Belizean vs Immigrants from Western Africa 8th Grade
COMPARE
Belizean
Immigrants from Western Africa
8th Grade
8th Grade Comparison
Belizeans
Immigrants from Western Africa
93.1%
8TH GRADE
0.0/ 100
METRIC RATING
321st/ 347
METRIC RANK
94.8%
8TH GRADE
0.2/ 100
METRIC RATING
273rd/ 347
METRIC RANK
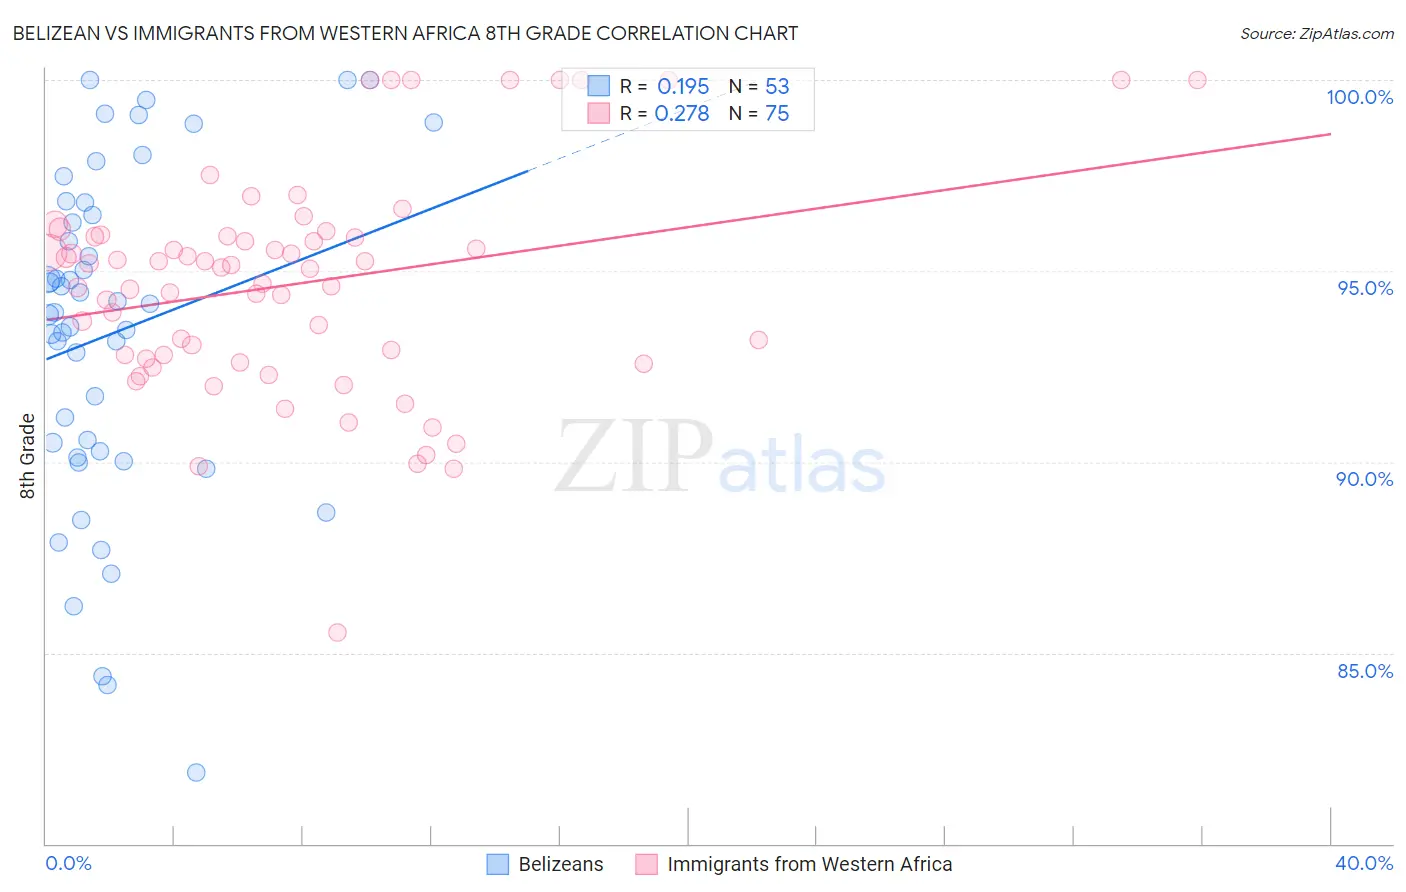
Belizean vs Immigrants from Western Africa 8th Grade Correlation Chart
The statistical analysis conducted on geographies consisting of 144,138,333 people shows a poor positive correlation between the proportion of Belizeans and percentage of population with at least 8th grade education in the United States with a correlation coefficient (R) of 0.195 and weighted average of 93.1%. Similarly, the statistical analysis conducted on geographies consisting of 357,883,667 people shows a weak positive correlation between the proportion of Immigrants from Western Africa and percentage of population with at least 8th grade education in the United States with a correlation coefficient (R) of 0.278 and weighted average of 94.8%, a difference of 1.8%.
8th Grade Correlation Summary
| Measurement | Belizean | Immigrants from Western Africa |
| Minimum | 81.9% | 85.5% |
| Maximum | 100.0% | 100.0% |
| Range | 18.1% | 14.5% |
| Mean | 93.4% | 94.7% |
| Median | 93.9% | 95.1% |
| Interquartile 25% (IQ1) | 90.2% | 92.7% |
| Interquartile 75% (IQ3) | 96.6% | 95.9% |
| Interquartile Range (IQR) | 6.4% | 3.2% |
| Standard Deviation (Sample) | 4.4% | 2.9% |
| Standard Deviation (Population) | 4.3% | 2.9% |
Similar Demographics by 8th Grade
Demographics Similar to Belizeans by 8th Grade
In terms of 8th grade, the demographic groups most similar to Belizeans are Nicaraguan (93.0%, a difference of 0.12%), Immigrants from Fiji (93.2%, a difference of 0.13%), Immigrants from Cuba (93.2%, a difference of 0.16%), Immigrants from Belize (92.9%, a difference of 0.17%), and Puerto Rican (93.2%, a difference of 0.19%).
| Demographics | Rating | Rank | 8th Grade |
| Immigrants | Vietnam | 0.0 /100 | #314 | Tragic 93.5% |
| Vietnamese | 0.0 /100 | #315 | Tragic 93.5% |
| Immigrants | Cambodia | 0.0 /100 | #316 | Tragic 93.3% |
| Immigrants | Ecuador | 0.0 /100 | #317 | Tragic 93.3% |
| Puerto Ricans | 0.0 /100 | #318 | Tragic 93.2% |
| Immigrants | Cuba | 0.0 /100 | #319 | Tragic 93.2% |
| Immigrants | Fiji | 0.0 /100 | #320 | Tragic 93.2% |
| Belizeans | 0.0 /100 | #321 | Tragic 93.1% |
| Nicaraguans | 0.0 /100 | #322 | Tragic 93.0% |
| Immigrants | Belize | 0.0 /100 | #323 | Tragic 92.9% |
| Nepalese | 0.0 /100 | #324 | Tragic 92.8% |
| Dominicans | 0.0 /100 | #325 | Tragic 92.8% |
| Central American Indians | 0.0 /100 | #326 | Tragic 92.7% |
| Immigrants | Azores | 0.0 /100 | #327 | Tragic 92.5% |
| Immigrants | Nicaragua | 0.0 /100 | #328 | Tragic 92.5% |
Demographics Similar to Immigrants from Western Africa by 8th Grade
In terms of 8th grade, the demographic groups most similar to Immigrants from Western Africa are Immigrants from South America (94.8%, a difference of 0.0%), Immigrants from Afghanistan (94.8%, a difference of 0.010%), Trinidadian and Tobagonian (94.7%, a difference of 0.010%), Immigrants from Uzbekistan (94.8%, a difference of 0.020%), and Immigrants from Colombia (94.7%, a difference of 0.020%).
| Demographics | Rating | Rank | 8th Grade |
| West Indians | 0.3 /100 | #266 | Tragic 94.8% |
| Immigrants | Ghana | 0.3 /100 | #267 | Tragic 94.8% |
| Immigrants | Uruguay | 0.3 /100 | #268 | Tragic 94.8% |
| Immigrants | Thailand | 0.2 /100 | #269 | Tragic 94.8% |
| Immigrants | Uzbekistan | 0.2 /100 | #270 | Tragic 94.8% |
| Immigrants | Afghanistan | 0.2 /100 | #271 | Tragic 94.8% |
| Immigrants | South America | 0.2 /100 | #272 | Tragic 94.8% |
| Immigrants | Western Africa | 0.2 /100 | #273 | Tragic 94.8% |
| Trinidadians and Tobagonians | 0.2 /100 | #274 | Tragic 94.7% |
| Immigrants | Colombia | 0.2 /100 | #275 | Tragic 94.7% |
| Peruvians | 0.1 /100 | #276 | Tragic 94.7% |
| Taiwanese | 0.1 /100 | #277 | Tragic 94.7% |
| Armenians | 0.1 /100 | #278 | Tragic 94.7% |
| Immigrants | Trinidad and Tobago | 0.1 /100 | #279 | Tragic 94.6% |
| Barbadians | 0.1 /100 | #280 | Tragic 94.6% |