Belizean vs Immigrants from Latin America 8th Grade
COMPARE
Belizean
Immigrants from Latin America
8th Grade
8th Grade Comparison
Belizeans
Immigrants from Latin America
93.1%
8TH GRADE
0.0/ 100
METRIC RATING
321st/ 347
METRIC RANK
91.7%
8TH GRADE
0.0/ 100
METRIC RATING
337th/ 347
METRIC RANK
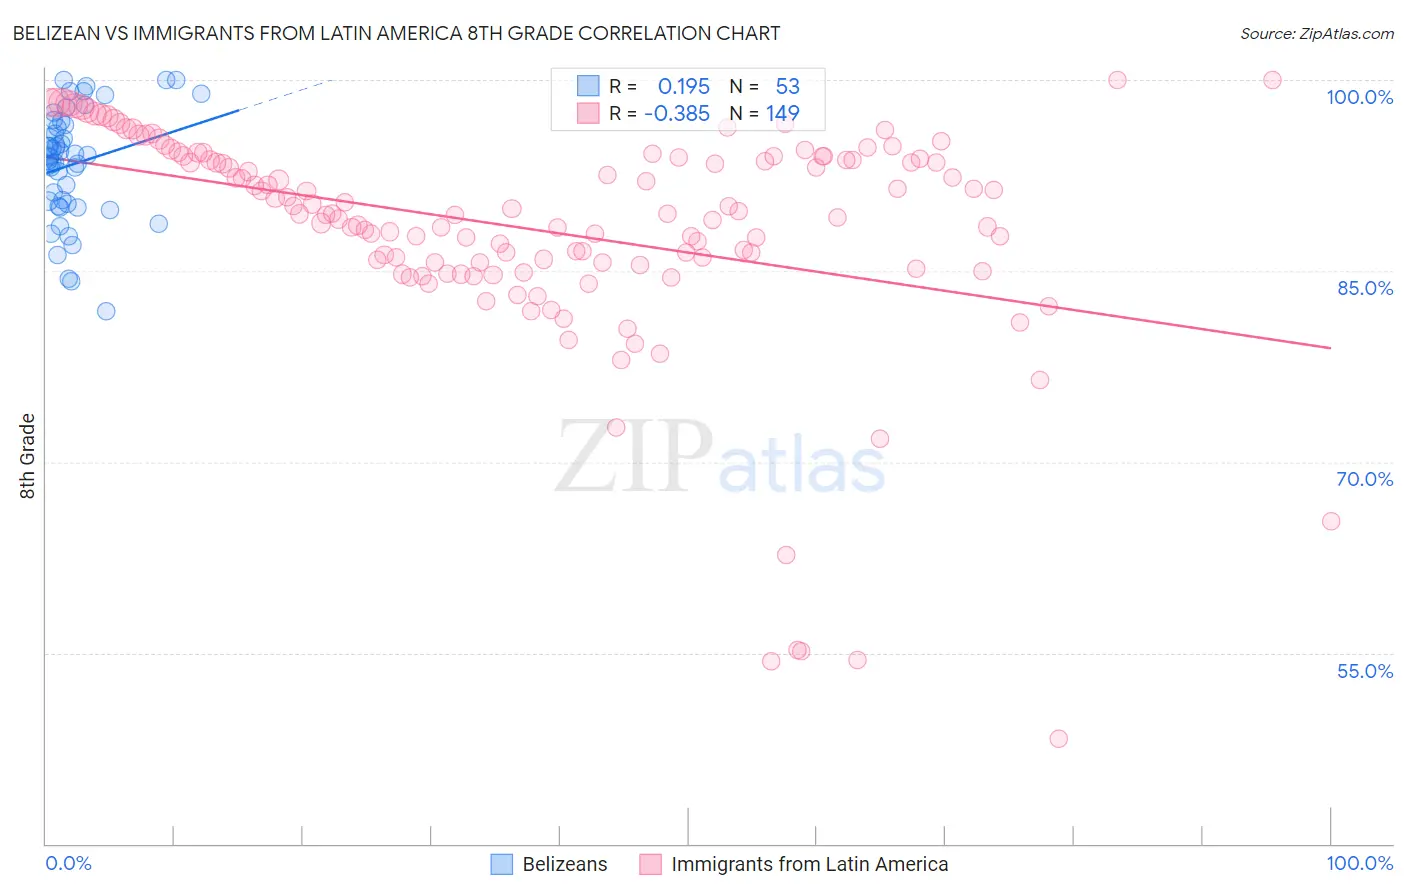
Belizean vs Immigrants from Latin America 8th Grade Correlation Chart
The statistical analysis conducted on geographies consisting of 144,138,333 people shows a poor positive correlation between the proportion of Belizeans and percentage of population with at least 8th grade education in the United States with a correlation coefficient (R) of 0.195 and weighted average of 93.1%. Similarly, the statistical analysis conducted on geographies consisting of 558,651,799 people shows a mild negative correlation between the proportion of Immigrants from Latin America and percentage of population with at least 8th grade education in the United States with a correlation coefficient (R) of -0.385 and weighted average of 91.7%, a difference of 1.5%.
8th Grade Correlation Summary
| Measurement | Belizean | Immigrants from Latin America |
| Minimum | 81.9% | 48.3% |
| Maximum | 100.0% | 100.0% |
| Range | 18.1% | 51.7% |
| Mean | 93.4% | 88.2% |
| Median | 93.9% | 89.5% |
| Interquartile 25% (IQ1) | 90.2% | 85.6% |
| Interquartile 75% (IQ3) | 96.6% | 94.0% |
| Interquartile Range (IQR) | 6.4% | 8.4% |
| Standard Deviation (Sample) | 4.4% | 9.0% |
| Standard Deviation (Population) | 4.3% | 8.9% |
Demographics Similar to Belizeans and Immigrants from Latin America by 8th Grade
In terms of 8th grade, the demographic groups most similar to Belizeans are Nicaraguan (93.0%, a difference of 0.12%), Immigrants from Fiji (93.2%, a difference of 0.13%), Immigrants from Cuba (93.2%, a difference of 0.16%), Immigrants from Belize (92.9%, a difference of 0.17%), and Nepalese (92.8%, a difference of 0.24%). Similarly, the demographic groups most similar to Immigrants from Latin America are Central American (91.6%, a difference of 0.14%), Immigrants from Honduras (91.9%, a difference of 0.23%), Mexican (91.4%, a difference of 0.37%), Mexican American Indian (92.1%, a difference of 0.42%), and Immigrants from Yemen (92.1%, a difference of 0.47%).
| Demographics | Rating | Rank | 8th Grade |
| Immigrants | Cuba | 0.0 /100 | #319 | Tragic 93.2% |
| Immigrants | Fiji | 0.0 /100 | #320 | Tragic 93.2% |
| Belizeans | 0.0 /100 | #321 | Tragic 93.1% |
| Nicaraguans | 0.0 /100 | #322 | Tragic 93.0% |
| Immigrants | Belize | 0.0 /100 | #323 | Tragic 92.9% |
| Nepalese | 0.0 /100 | #324 | Tragic 92.8% |
| Dominicans | 0.0 /100 | #325 | Tragic 92.8% |
| Central American Indians | 0.0 /100 | #326 | Tragic 92.7% |
| Immigrants | Azores | 0.0 /100 | #327 | Tragic 92.5% |
| Immigrants | Nicaragua | 0.0 /100 | #328 | Tragic 92.5% |
| Immigrants | Cabo Verde | 0.0 /100 | #329 | Tragic 92.4% |
| Immigrants | Armenia | 0.0 /100 | #330 | Tragic 92.3% |
| Hondurans | 0.0 /100 | #331 | Tragic 92.3% |
| Immigrants | Dominican Republic | 0.0 /100 | #332 | Tragic 92.3% |
| Hispanics or Latinos | 0.0 /100 | #333 | Tragic 92.2% |
| Immigrants | Yemen | 0.0 /100 | #334 | Tragic 92.1% |
| Mexican American Indians | 0.0 /100 | #335 | Tragic 92.1% |
| Immigrants | Honduras | 0.0 /100 | #336 | Tragic 91.9% |
| Immigrants | Latin America | 0.0 /100 | #337 | Tragic 91.7% |
| Central Americans | 0.0 /100 | #338 | Tragic 91.6% |
| Mexicans | 0.0 /100 | #339 | Tragic 91.4% |