Belizean vs West Indian 8th Grade
COMPARE
Belizean
West Indian
8th Grade
8th Grade Comparison
Belizeans
West Indians
93.1%
8TH GRADE
0.0/ 100
METRIC RATING
321st/ 347
METRIC RANK
94.8%
8TH GRADE
0.3/ 100
METRIC RATING
266th/ 347
METRIC RANK
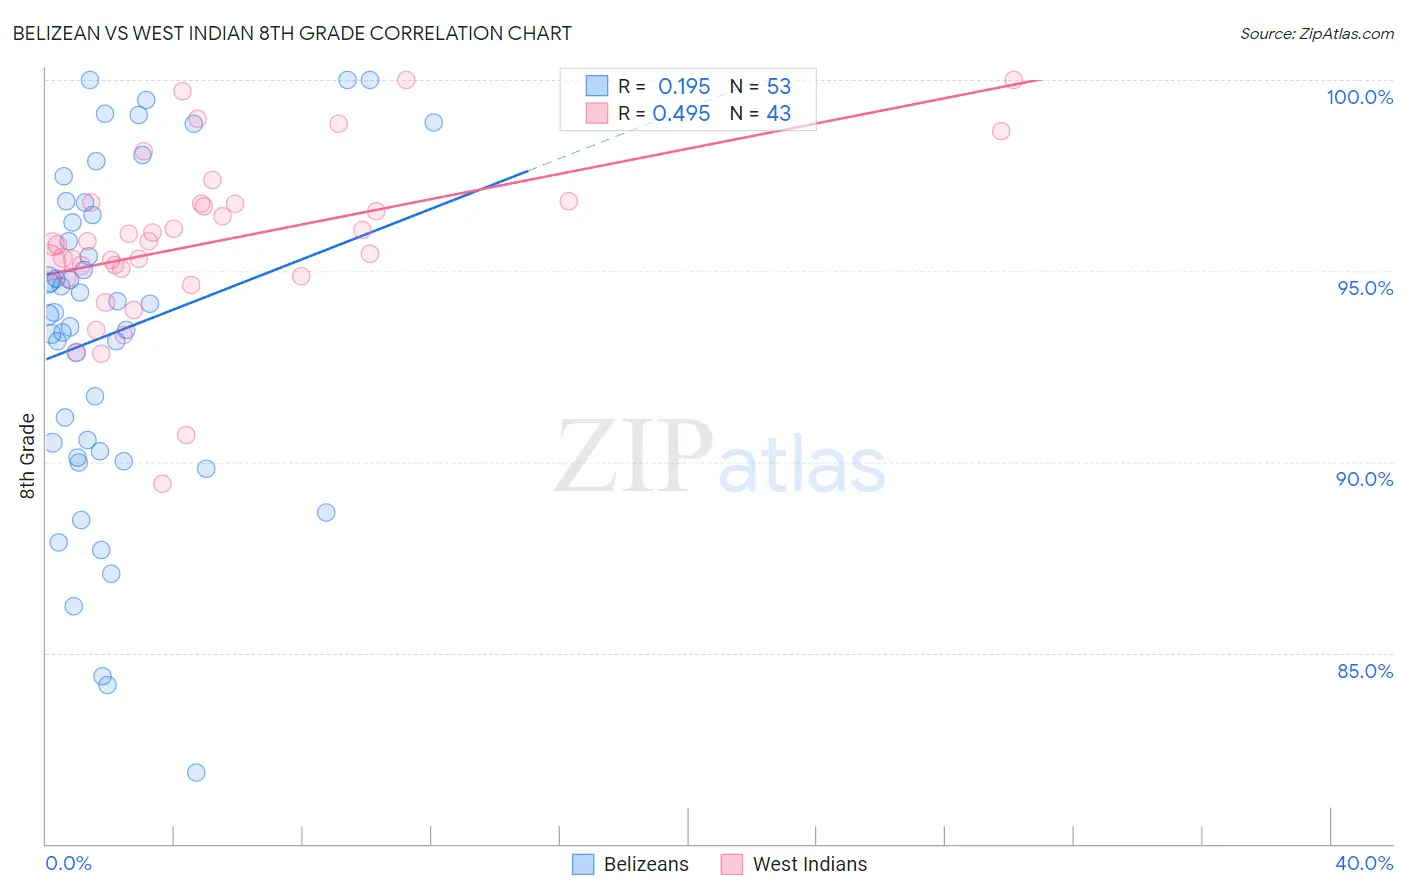
Belizean vs West Indian 8th Grade Correlation Chart
The statistical analysis conducted on geographies consisting of 144,138,333 people shows a poor positive correlation between the proportion of Belizeans and percentage of population with at least 8th grade education in the United States with a correlation coefficient (R) of 0.195 and weighted average of 93.1%. Similarly, the statistical analysis conducted on geographies consisting of 254,059,006 people shows a moderate positive correlation between the proportion of West Indians and percentage of population with at least 8th grade education in the United States with a correlation coefficient (R) of 0.495 and weighted average of 94.8%, a difference of 1.9%.
8th Grade Correlation Summary
| Measurement | Belizean | West Indian |
| Minimum | 81.9% | 89.4% |
| Maximum | 100.0% | 100.0% |
| Range | 18.1% | 10.6% |
| Mean | 93.4% | 95.8% |
| Median | 93.9% | 95.7% |
| Interquartile 25% (IQ1) | 90.2% | 94.9% |
| Interquartile 75% (IQ3) | 96.6% | 96.8% |
| Interquartile Range (IQR) | 6.4% | 1.9% |
| Standard Deviation (Sample) | 4.4% | 2.2% |
| Standard Deviation (Population) | 4.3% | 2.2% |
Similar Demographics by 8th Grade
Demographics Similar to Belizeans by 8th Grade
In terms of 8th grade, the demographic groups most similar to Belizeans are Nicaraguan (93.0%, a difference of 0.12%), Immigrants from Fiji (93.2%, a difference of 0.13%), Immigrants from Cuba (93.2%, a difference of 0.16%), Immigrants from Belize (92.9%, a difference of 0.17%), and Puerto Rican (93.2%, a difference of 0.19%).
| Demographics | Rating | Rank | 8th Grade |
| Immigrants | Vietnam | 0.0 /100 | #314 | Tragic 93.5% |
| Vietnamese | 0.0 /100 | #315 | Tragic 93.5% |
| Immigrants | Cambodia | 0.0 /100 | #316 | Tragic 93.3% |
| Immigrants | Ecuador | 0.0 /100 | #317 | Tragic 93.3% |
| Puerto Ricans | 0.0 /100 | #318 | Tragic 93.2% |
| Immigrants | Cuba | 0.0 /100 | #319 | Tragic 93.2% |
| Immigrants | Fiji | 0.0 /100 | #320 | Tragic 93.2% |
| Belizeans | 0.0 /100 | #321 | Tragic 93.1% |
| Nicaraguans | 0.0 /100 | #322 | Tragic 93.0% |
| Immigrants | Belize | 0.0 /100 | #323 | Tragic 92.9% |
| Nepalese | 0.0 /100 | #324 | Tragic 92.8% |
| Dominicans | 0.0 /100 | #325 | Tragic 92.8% |
| Central American Indians | 0.0 /100 | #326 | Tragic 92.7% |
| Immigrants | Azores | 0.0 /100 | #327 | Tragic 92.5% |
| Immigrants | Nicaragua | 0.0 /100 | #328 | Tragic 92.5% |
Demographics Similar to West Indians by 8th Grade
In terms of 8th grade, the demographic groups most similar to West Indians are Immigrants from Ghana (94.8%, a difference of 0.010%), Immigrants from Uruguay (94.8%, a difference of 0.020%), Yuman (94.9%, a difference of 0.040%), Immigrants from Thailand (94.8%, a difference of 0.040%), and Immigrants from Hong Kong (94.9%, a difference of 0.050%).
| Demographics | Rating | Rank | 8th Grade |
| Ghanaians | 0.6 /100 | #259 | Tragic 94.9% |
| Immigrants | Jamaica | 0.6 /100 | #260 | Tragic 94.9% |
| Immigrants | Costa Rica | 0.5 /100 | #261 | Tragic 94.9% |
| Immigrants | Nigeria | 0.4 /100 | #262 | Tragic 94.9% |
| Immigrants | Hong Kong | 0.4 /100 | #263 | Tragic 94.9% |
| South Americans | 0.4 /100 | #264 | Tragic 94.9% |
| Yuman | 0.4 /100 | #265 | Tragic 94.9% |
| West Indians | 0.3 /100 | #266 | Tragic 94.8% |
| Immigrants | Ghana | 0.3 /100 | #267 | Tragic 94.8% |
| Immigrants | Uruguay | 0.3 /100 | #268 | Tragic 94.8% |
| Immigrants | Thailand | 0.2 /100 | #269 | Tragic 94.8% |
| Immigrants | Uzbekistan | 0.2 /100 | #270 | Tragic 94.8% |
| Immigrants | Afghanistan | 0.2 /100 | #271 | Tragic 94.8% |
| Immigrants | South America | 0.2 /100 | #272 | Tragic 94.8% |
| Immigrants | Western Africa | 0.2 /100 | #273 | Tragic 94.8% |