Immigrants from Zimbabwe vs Swedish College, 1 year or more
COMPARE
Immigrants from Zimbabwe
Swedish
College, 1 year or more
College, 1 year or more Comparison
Immigrants from Zimbabwe
Swedes
63.3%
COLLEGE, 1 YEAR OR MORE
99.3/ 100
METRIC RATING
69th/ 347
METRIC RANK
62.1%
COLLEGE, 1 YEAR OR MORE
96.8/ 100
METRIC RATING
101st/ 347
METRIC RANK
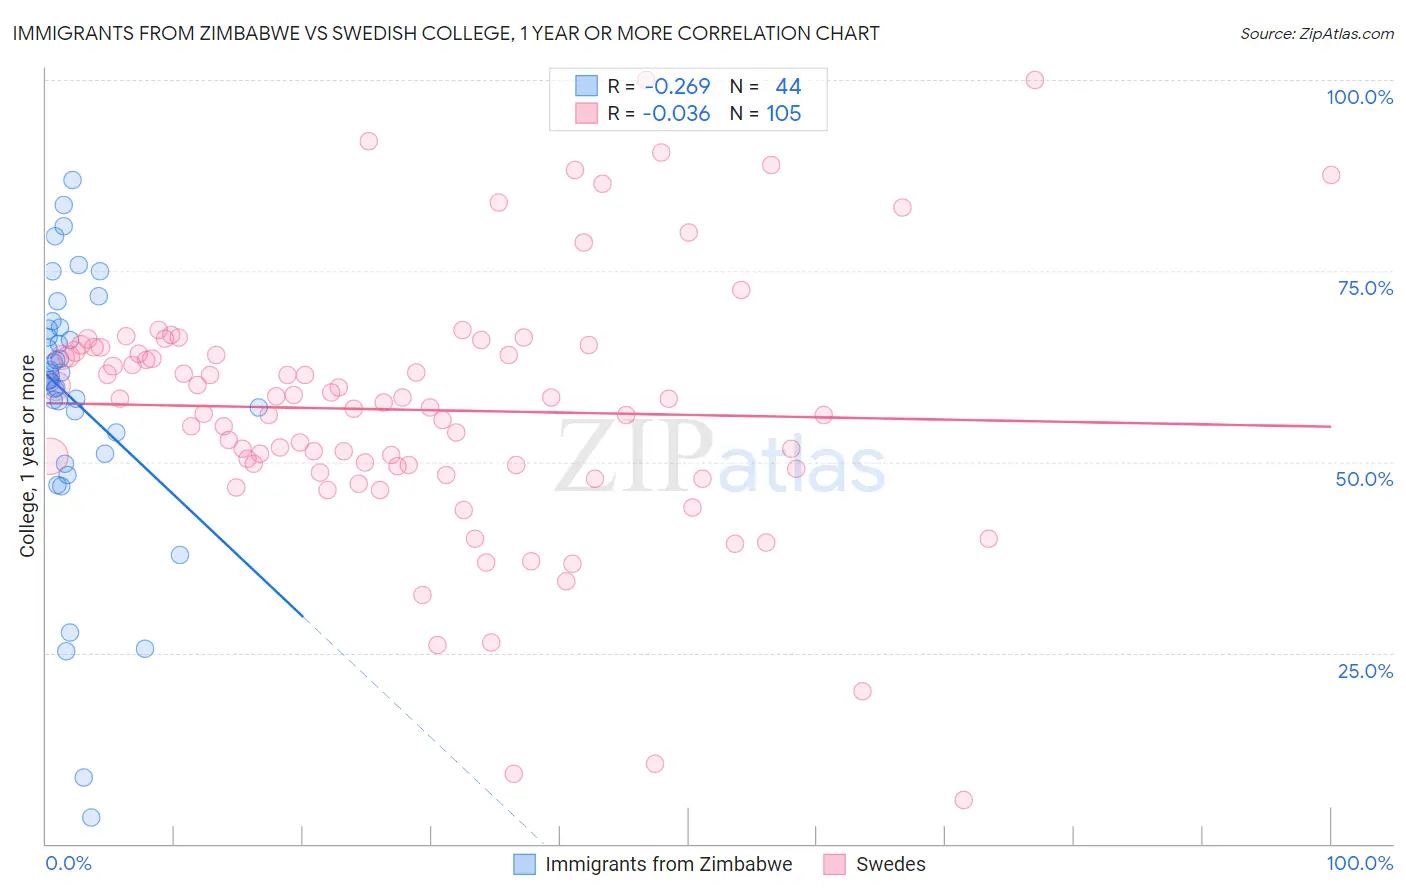
Immigrants from Zimbabwe vs Swedish College, 1 year or more Correlation Chart
The statistical analysis conducted on geographies consisting of 117,809,864 people shows a weak negative correlation between the proportion of Immigrants from Zimbabwe and percentage of population with at least college, 1 year or more education in the United States with a correlation coefficient (R) of -0.269 and weighted average of 63.3%. Similarly, the statistical analysis conducted on geographies consisting of 539,224,370 people shows no correlation between the proportion of Swedes and percentage of population with at least college, 1 year or more education in the United States with a correlation coefficient (R) of -0.036 and weighted average of 62.1%, a difference of 1.9%.
College, 1 year or more Correlation Summary
| Measurement | Immigrants from Zimbabwe | Swedish |
| Minimum | 3.5% | 5.7% |
| Maximum | 87.0% | 100.0% |
| Range | 83.5% | 94.3% |
| Mean | 58.0% | 56.8% |
| Median | 60.9% | 57.8% |
| Interquartile 25% (IQ1) | 52.5% | 49.2% |
| Interquartile 75% (IQ3) | 67.5% | 64.7% |
| Interquartile Range (IQR) | 15.0% | 15.5% |
| Standard Deviation (Sample) | 17.9% | 16.9% |
| Standard Deviation (Population) | 17.7% | 16.9% |
Similar Demographics by College, 1 year or more
Demographics Similar to Immigrants from Zimbabwe by College, 1 year or more
In terms of college, 1 year or more, the demographic groups most similar to Immigrants from Zimbabwe are Immigrants from Greece (63.3%, a difference of 0.0%), Immigrants from Romania (63.3%, a difference of 0.020%), Immigrants from Europe (63.3%, a difference of 0.040%), Argentinean (63.2%, a difference of 0.10%), and Maltese (63.4%, a difference of 0.14%).
| Demographics | Rating | Rank | College, 1 year or more |
| Immigrants | Indonesia | 99.5 /100 | #62 | Exceptional 63.5% |
| Immigrants | Scotland | 99.4 /100 | #63 | Exceptional 63.4% |
| Immigrants | Spain | 99.4 /100 | #64 | Exceptional 63.4% |
| Maltese | 99.3 /100 | #65 | Exceptional 63.4% |
| Immigrants | Europe | 99.3 /100 | #66 | Exceptional 63.3% |
| Immigrants | Romania | 99.3 /100 | #67 | Exceptional 63.3% |
| Immigrants | Greece | 99.3 /100 | #68 | Exceptional 63.3% |
| Immigrants | Zimbabwe | 99.3 /100 | #69 | Exceptional 63.3% |
| Argentineans | 99.2 /100 | #70 | Exceptional 63.2% |
| Immigrants | Canada | 99.1 /100 | #71 | Exceptional 63.1% |
| Egyptians | 99.0 /100 | #72 | Exceptional 63.1% |
| Immigrants | Moldova | 99.0 /100 | #73 | Exceptional 63.0% |
| Immigrants | North America | 99.0 /100 | #74 | Exceptional 63.0% |
| Armenians | 98.9 /100 | #75 | Exceptional 63.0% |
| Paraguayans | 98.8 /100 | #76 | Exceptional 62.9% |
Demographics Similar to Swedes by College, 1 year or more
In terms of college, 1 year or more, the demographic groups most similar to Swedes are Icelander (62.1%, a difference of 0.0%), Luxembourger (62.1%, a difference of 0.020%), Afghan (62.0%, a difference of 0.13%), Chilean (62.0%, a difference of 0.14%), and Immigrants from Nepal (62.0%, a difference of 0.16%).
| Demographics | Rating | Rank | College, 1 year or more |
| Immigrants | Croatia | 97.6 /100 | #94 | Exceptional 62.3% |
| British | 97.4 /100 | #95 | Exceptional 62.3% |
| Chinese | 97.2 /100 | #96 | Exceptional 62.2% |
| Jordanians | 97.2 /100 | #97 | Exceptional 62.2% |
| Carpatho Rusyns | 97.2 /100 | #98 | Exceptional 62.2% |
| Croatians | 97.1 /100 | #99 | Exceptional 62.2% |
| Icelanders | 96.8 /100 | #100 | Exceptional 62.1% |
| Swedes | 96.8 /100 | #101 | Exceptional 62.1% |
| Luxembourgers | 96.7 /100 | #102 | Exceptional 62.1% |
| Afghans | 96.4 /100 | #103 | Exceptional 62.0% |
| Chileans | 96.4 /100 | #104 | Exceptional 62.0% |
| Immigrants | Nepal | 96.3 /100 | #105 | Exceptional 62.0% |
| Palestinians | 96.3 /100 | #106 | Exceptional 62.0% |
| Immigrants | Ukraine | 95.8 /100 | #107 | Exceptional 61.9% |
| Syrians | 95.7 /100 | #108 | Exceptional 61.9% |