Celtic vs Swedish College, 1 year or more
COMPARE
Celtic
Swedish
College, 1 year or more
College, 1 year or more Comparison
Celtics
Swedes
59.4%
COLLEGE, 1 YEAR OR MORE
50.0/ 100
METRIC RATING
174th/ 347
METRIC RANK
62.1%
COLLEGE, 1 YEAR OR MORE
96.8/ 100
METRIC RATING
101st/ 347
METRIC RANK
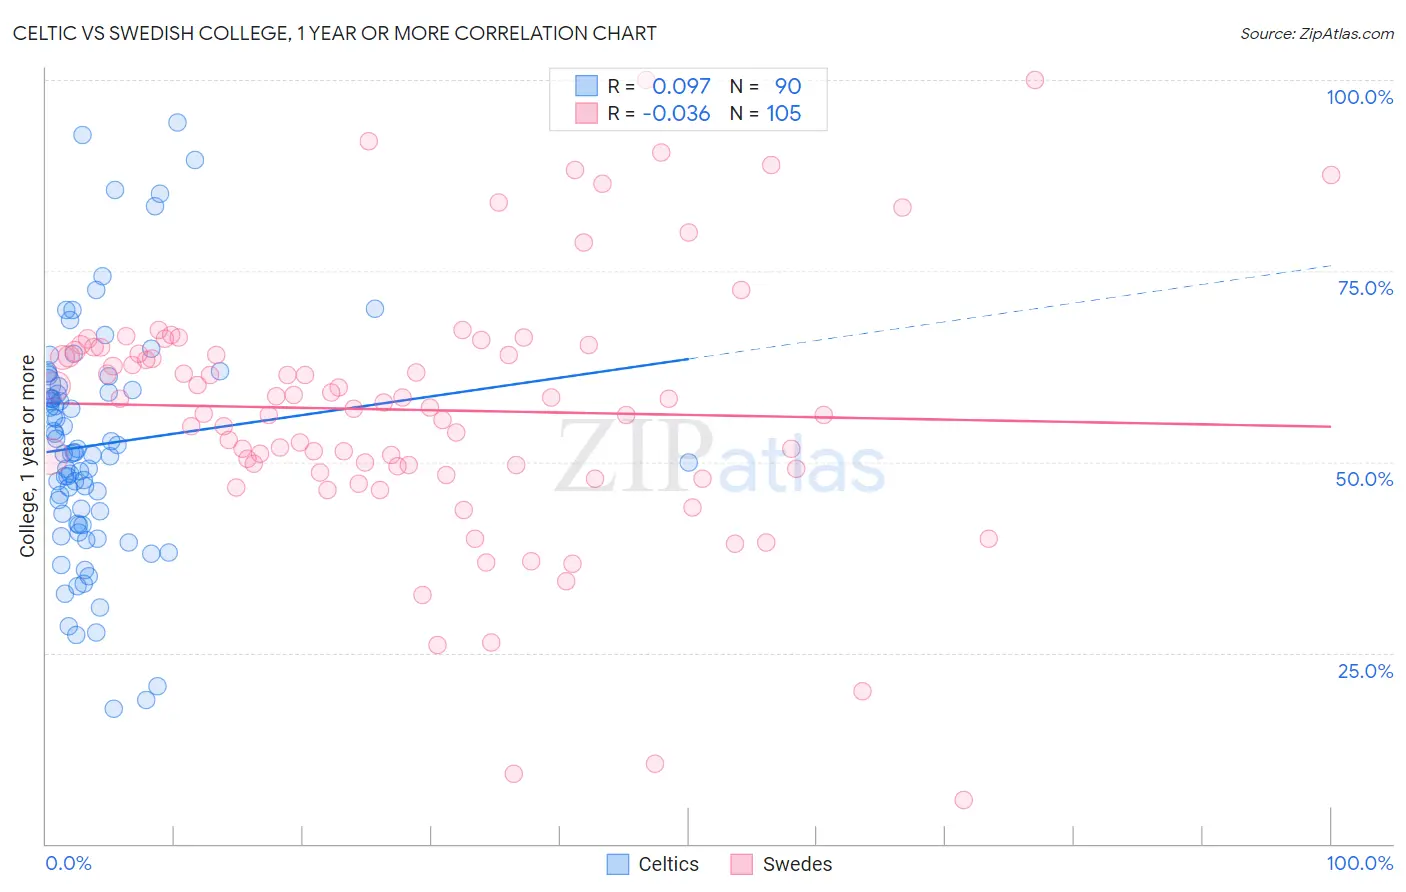
Celtic vs Swedish College, 1 year or more Correlation Chart
The statistical analysis conducted on geographies consisting of 168,877,347 people shows a slight positive correlation between the proportion of Celtics and percentage of population with at least college, 1 year or more education in the United States with a correlation coefficient (R) of 0.097 and weighted average of 59.4%. Similarly, the statistical analysis conducted on geographies consisting of 539,224,370 people shows no correlation between the proportion of Swedes and percentage of population with at least college, 1 year or more education in the United States with a correlation coefficient (R) of -0.036 and weighted average of 62.1%, a difference of 4.5%.
College, 1 year or more Correlation Summary
| Measurement | Celtic | Swedish |
| Minimum | 17.6% | 5.7% |
| Maximum | 94.4% | 100.0% |
| Range | 76.8% | 94.3% |
| Mean | 52.2% | 56.8% |
| Median | 51.2% | 57.8% |
| Interquartile 25% (IQ1) | 41.8% | 49.2% |
| Interquartile 75% (IQ3) | 59.9% | 64.7% |
| Interquartile Range (IQR) | 18.0% | 15.5% |
| Standard Deviation (Sample) | 15.4% | 16.9% |
| Standard Deviation (Population) | 15.4% | 16.9% |
Similar Demographics by College, 1 year or more
Demographics Similar to Celtics by College, 1 year or more
In terms of college, 1 year or more, the demographic groups most similar to Celtics are Sri Lankan (59.4%, a difference of 0.050%), Immigrants from Oceania (59.4%, a difference of 0.060%), Immigrants from Poland (59.4%, a difference of 0.060%), Tlingit-Haida (59.4%, a difference of 0.080%), and Czechoslovakian (59.4%, a difference of 0.090%).
| Demographics | Rating | Rank | College, 1 year or more |
| Immigrants | North Macedonia | 53.1 /100 | #167 | Average 59.5% |
| Hungarians | 52.9 /100 | #168 | Average 59.5% |
| Immigrants | Southern Europe | 52.7 /100 | #169 | Average 59.5% |
| Welsh | 52.4 /100 | #170 | Average 59.5% |
| Immigrants | Albania | 52.3 /100 | #171 | Average 59.5% |
| Immigrants | Sierra Leone | 52.2 /100 | #172 | Average 59.5% |
| Immigrants | Oceania | 51.2 /100 | #173 | Average 59.4% |
| Celtics | 50.0 /100 | #174 | Average 59.4% |
| Sri Lankans | 49.0 /100 | #175 | Average 59.4% |
| Immigrants | Poland | 48.9 /100 | #176 | Average 59.4% |
| Tlingit-Haida | 48.4 /100 | #177 | Average 59.4% |
| Czechoslovakians | 48.3 /100 | #178 | Average 59.4% |
| Bermudans | 46.6 /100 | #179 | Average 59.3% |
| Yugoslavians | 44.1 /100 | #180 | Average 59.2% |
| Swiss | 43.4 /100 | #181 | Average 59.2% |
Demographics Similar to Swedes by College, 1 year or more
In terms of college, 1 year or more, the demographic groups most similar to Swedes are Icelander (62.1%, a difference of 0.0%), Luxembourger (62.1%, a difference of 0.020%), Afghan (62.0%, a difference of 0.13%), Chilean (62.0%, a difference of 0.14%), and Immigrants from Nepal (62.0%, a difference of 0.16%).
| Demographics | Rating | Rank | College, 1 year or more |
| Immigrants | Croatia | 97.6 /100 | #94 | Exceptional 62.3% |
| British | 97.4 /100 | #95 | Exceptional 62.3% |
| Chinese | 97.2 /100 | #96 | Exceptional 62.2% |
| Jordanians | 97.2 /100 | #97 | Exceptional 62.2% |
| Carpatho Rusyns | 97.2 /100 | #98 | Exceptional 62.2% |
| Croatians | 97.1 /100 | #99 | Exceptional 62.2% |
| Icelanders | 96.8 /100 | #100 | Exceptional 62.1% |
| Swedes | 96.8 /100 | #101 | Exceptional 62.1% |
| Luxembourgers | 96.7 /100 | #102 | Exceptional 62.1% |
| Afghans | 96.4 /100 | #103 | Exceptional 62.0% |
| Chileans | 96.4 /100 | #104 | Exceptional 62.0% |
| Immigrants | Nepal | 96.3 /100 | #105 | Exceptional 62.0% |
| Palestinians | 96.3 /100 | #106 | Exceptional 62.0% |
| Immigrants | Ukraine | 95.8 /100 | #107 | Exceptional 61.9% |
| Syrians | 95.7 /100 | #108 | Exceptional 61.9% |