Immigrants from Cambodia vs Iroquois No Schooling Completed
COMPARE
Immigrants from Cambodia
Iroquois
No Schooling Completed
No Schooling Completed Comparison
Immigrants from Cambodia
Iroquois
3.5%
NO SCHOOLING COMPLETED
0.0/ 100
METRIC RATING
335th/ 347
METRIC RANK
1.9%
NO SCHOOLING COMPLETED
95.1/ 100
METRIC RATING
119th/ 347
METRIC RANK
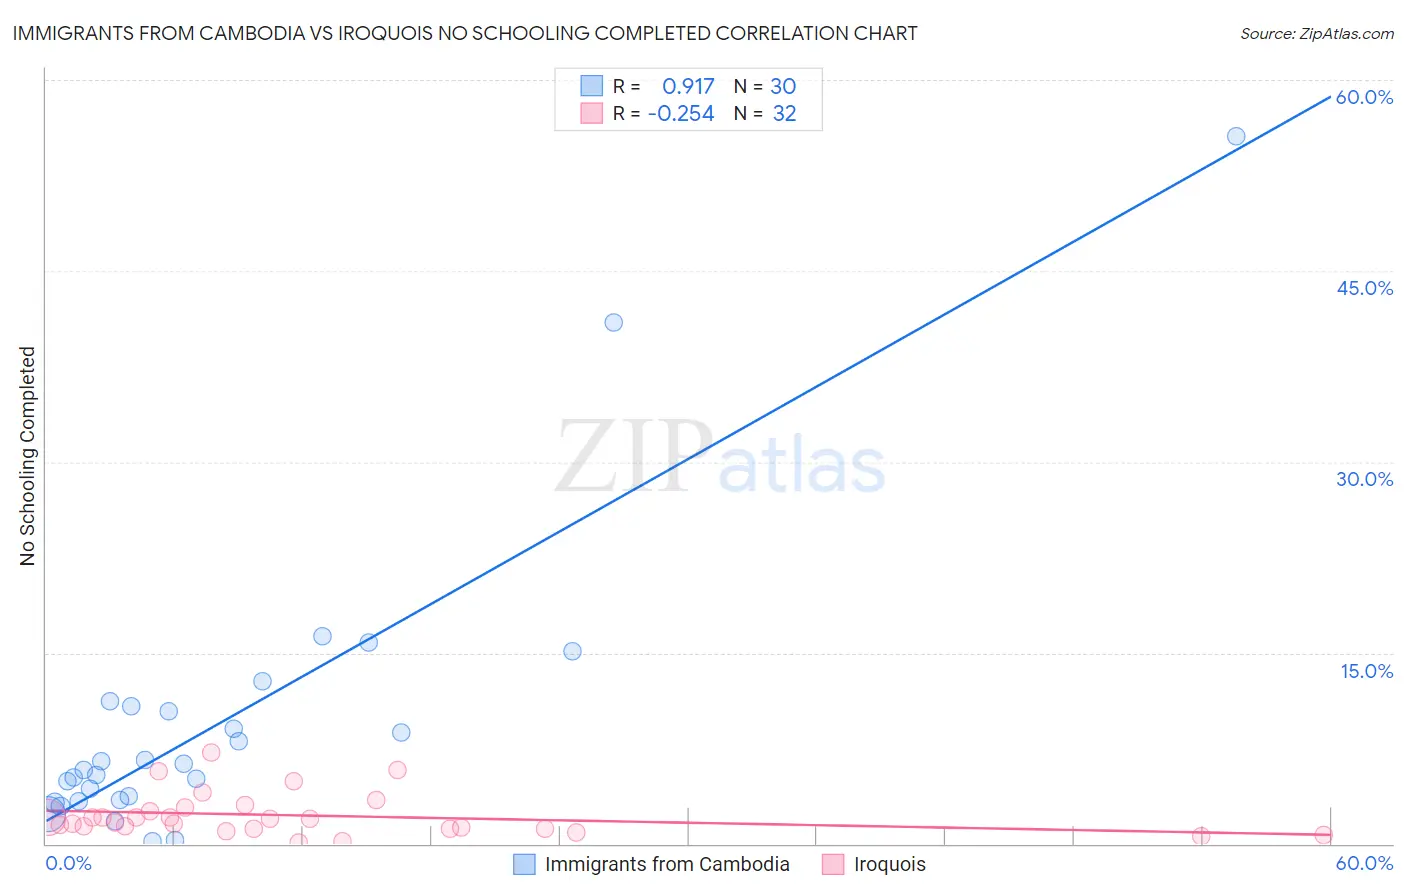
Immigrants from Cambodia vs Iroquois No Schooling Completed Correlation Chart
The statistical analysis conducted on geographies consisting of 204,723,315 people shows a near-perfect positive correlation between the proportion of Immigrants from Cambodia and percentage of population with no schooling in the United States with a correlation coefficient (R) of 0.917 and weighted average of 3.5%. Similarly, the statistical analysis conducted on geographies consisting of 205,850,769 people shows a weak negative correlation between the proportion of Iroquois and percentage of population with no schooling in the United States with a correlation coefficient (R) of -0.254 and weighted average of 1.9%, a difference of 85.7%.
No Schooling Completed Correlation Summary
| Measurement | Immigrants from Cambodia | Iroquois |
| Minimum | 0.15% | 0.10% |
| Maximum | 55.6% | 7.1% |
| Range | 55.4% | 7.0% |
| Mean | 9.5% | 2.2% |
| Median | 6.0% | 1.8% |
| Interquartile 25% (IQ1) | 3.4% | 1.2% |
| Interquartile 75% (IQ3) | 10.8% | 2.7% |
| Interquartile Range (IQR) | 7.4% | 1.5% |
| Standard Deviation (Sample) | 11.5% | 1.7% |
| Standard Deviation (Population) | 11.4% | 1.6% |
Similar Demographics by No Schooling Completed
Demographics Similar to Immigrants from Cambodia by No Schooling Completed
In terms of no schooling completed, the demographic groups most similar to Immigrants from Cambodia are Immigrants from Fiji (3.5%, a difference of 0.37%), Guatemalan (3.5%, a difference of 1.0%), Immigrants from Cabo Verde (3.5%, a difference of 1.1%), Bangladeshi (3.5%, a difference of 1.3%), and Yakama (3.6%, a difference of 1.6%).
| Demographics | Rating | Rank | No Schooling Completed |
| Mexicans | 0.0 /100 | #328 | Tragic 3.3% |
| Immigrants | Vietnam | 0.0 /100 | #329 | Tragic 3.3% |
| Immigrants | Armenia | 0.0 /100 | #330 | Tragic 3.3% |
| Japanese | 0.0 /100 | #331 | Tragic 3.3% |
| Central Americans | 0.0 /100 | #332 | Tragic 3.4% |
| Immigrants | Dominican Republic | 0.0 /100 | #333 | Tragic 3.4% |
| Guatemalans | 0.0 /100 | #334 | Tragic 3.5% |
| Immigrants | Cambodia | 0.0 /100 | #335 | Tragic 3.5% |
| Immigrants | Fiji | 0.0 /100 | #336 | Tragic 3.5% |
| Immigrants | Cabo Verde | 0.0 /100 | #337 | Tragic 3.5% |
| Bangladeshis | 0.0 /100 | #338 | Tragic 3.5% |
| Yakama | 0.0 /100 | #339 | Tragic 3.6% |
| Immigrants | Guatemala | 0.0 /100 | #340 | Tragic 3.6% |
| Immigrants | Central America | 0.0 /100 | #341 | Tragic 3.6% |
| Immigrants | Mexico | 0.0 /100 | #342 | Tragic 3.6% |
Demographics Similar to Iroquois by No Schooling Completed
In terms of no schooling completed, the demographic groups most similar to Iroquois are Spanish (1.9%, a difference of 0.35%), Immigrants from Bulgaria (1.9%, a difference of 0.40%), Immigrants from Croatia (1.9%, a difference of 0.47%), Cree (1.9%, a difference of 0.50%), and Immigrants from Serbia (1.9%, a difference of 0.58%).
| Demographics | Rating | Rank | No Schooling Completed |
| Pueblo | 96.4 /100 | #112 | Exceptional 1.9% |
| Immigrants | Zimbabwe | 96.2 /100 | #113 | Exceptional 1.9% |
| Immigrants | Norway | 96.1 /100 | #114 | Exceptional 1.9% |
| Syrians | 96.0 /100 | #115 | Exceptional 1.9% |
| Lebanese | 96.0 /100 | #116 | Exceptional 1.9% |
| Immigrants | Serbia | 95.8 /100 | #117 | Exceptional 1.9% |
| Spanish | 95.5 /100 | #118 | Exceptional 1.9% |
| Iroquois | 95.1 /100 | #119 | Exceptional 1.9% |
| Immigrants | Bulgaria | 94.6 /100 | #120 | Exceptional 1.9% |
| Immigrants | Croatia | 94.5 /100 | #121 | Exceptional 1.9% |
| Cree | 94.5 /100 | #122 | Exceptional 1.9% |
| Immigrants | Kuwait | 93.9 /100 | #123 | Exceptional 1.9% |
| Cambodians | 93.8 /100 | #124 | Exceptional 1.9% |
| Immigrants | Europe | 93.7 /100 | #125 | Exceptional 1.9% |
| Immigrants | Romania | 92.6 /100 | #126 | Exceptional 1.9% |