Immigrants from Taiwan vs Iroquois No Schooling Completed
COMPARE
Immigrants from Taiwan
Iroquois
No Schooling Completed
No Schooling Completed Comparison
Immigrants from Taiwan
Iroquois
2.1%
NO SCHOOLING COMPLETED
42.6/ 100
METRIC RATING
181st/ 347
METRIC RANK
1.9%
NO SCHOOLING COMPLETED
95.1/ 100
METRIC RATING
119th/ 347
METRIC RANK
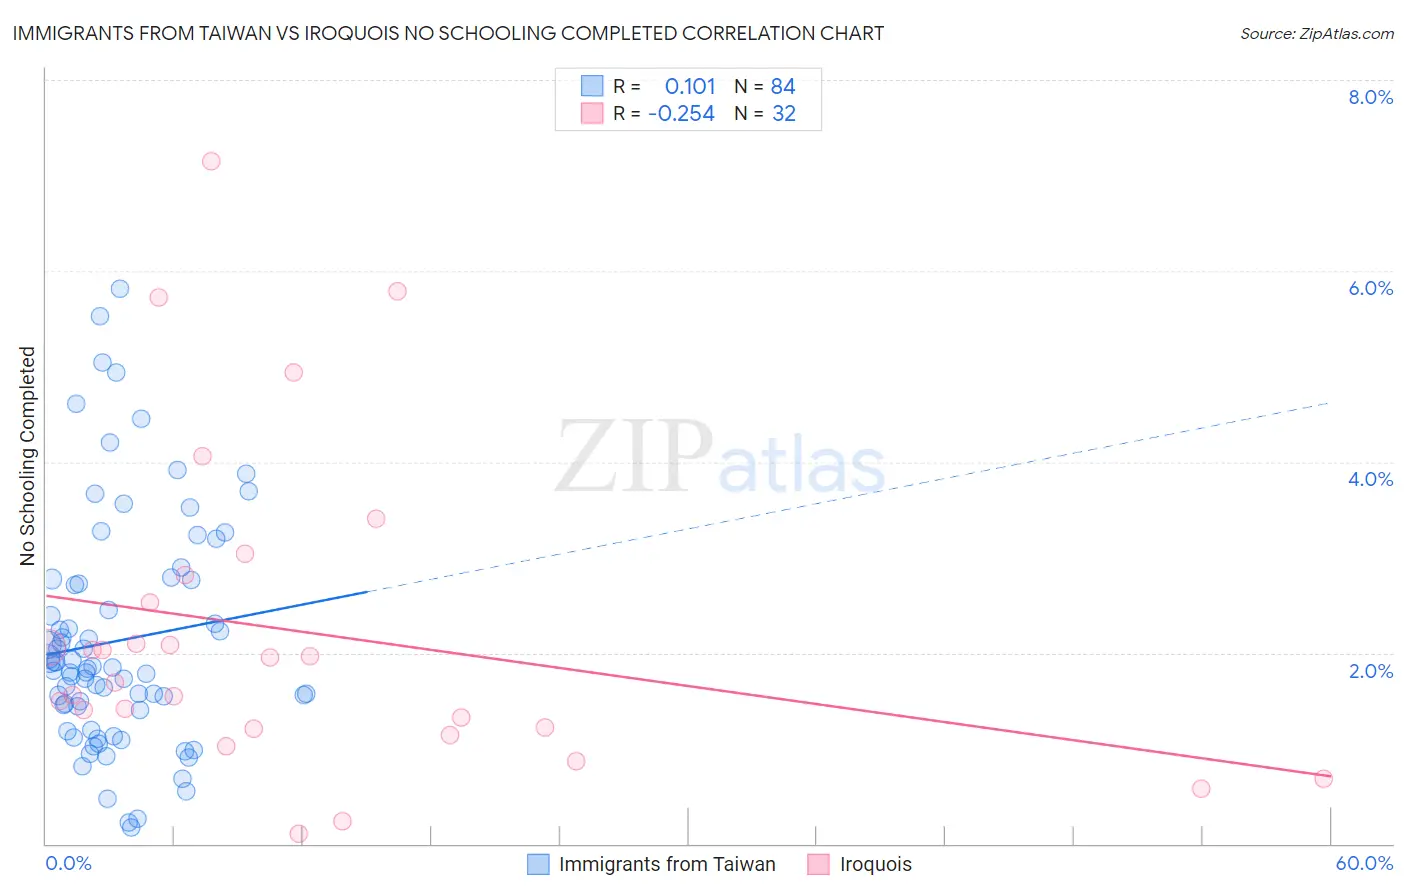
Immigrants from Taiwan vs Iroquois No Schooling Completed Correlation Chart
The statistical analysis conducted on geographies consisting of 295,749,298 people shows a poor positive correlation between the proportion of Immigrants from Taiwan and percentage of population with no schooling in the United States with a correlation coefficient (R) of 0.101 and weighted average of 2.1%. Similarly, the statistical analysis conducted on geographies consisting of 205,850,769 people shows a weak negative correlation between the proportion of Iroquois and percentage of population with no schooling in the United States with a correlation coefficient (R) of -0.254 and weighted average of 1.9%, a difference of 12.2%.
No Schooling Completed Correlation Summary
| Measurement | Immigrants from Taiwan | Iroquois |
| Minimum | 0.16% | 0.10% |
| Maximum | 5.8% | 7.1% |
| Range | 5.7% | 7.0% |
| Mean | 2.1% | 2.2% |
| Median | 1.8% | 1.8% |
| Interquartile 25% (IQ1) | 1.4% | 1.2% |
| Interquartile 75% (IQ3) | 2.7% | 2.7% |
| Interquartile Range (IQR) | 1.3% | 1.5% |
| Standard Deviation (Sample) | 1.2% | 1.7% |
| Standard Deviation (Population) | 1.2% | 1.6% |
Similar Demographics by No Schooling Completed
Demographics Similar to Immigrants from Taiwan by No Schooling Completed
In terms of no schooling completed, the demographic groups most similar to Immigrants from Taiwan are French American Indian (2.1%, a difference of 0.050%), Black/African American (2.1%, a difference of 0.15%), Pima (2.1%, a difference of 0.17%), Portuguese (2.1%, a difference of 0.18%), and Immigrants from Kazakhstan (2.1%, a difference of 0.24%).
| Demographics | Rating | Rank | No Schooling Completed |
| Immigrants | Micronesia | 50.0 /100 | #174 | Average 2.1% |
| Arabs | 46.4 /100 | #175 | Average 2.1% |
| Panamanians | 45.2 /100 | #176 | Average 2.1% |
| Arapaho | 45.0 /100 | #177 | Average 2.1% |
| Pakistanis | 44.7 /100 | #178 | Average 2.1% |
| Immigrants | Kazakhstan | 44.3 /100 | #179 | Average 2.1% |
| Portuguese | 43.9 /100 | #180 | Average 2.1% |
| Immigrants | Taiwan | 42.6 /100 | #181 | Average 2.1% |
| French American Indians | 42.2 /100 | #182 | Average 2.1% |
| Blacks/African Americans | 41.4 /100 | #183 | Average 2.1% |
| Pima | 41.3 /100 | #184 | Average 2.1% |
| Mongolians | 40.8 /100 | #185 | Average 2.1% |
| Immigrants | Bosnia and Herzegovina | 38.6 /100 | #186 | Fair 2.1% |
| Navajo | 36.5 /100 | #187 | Fair 2.1% |
| Immigrants | Kenya | 36.2 /100 | #188 | Fair 2.1% |
Demographics Similar to Iroquois by No Schooling Completed
In terms of no schooling completed, the demographic groups most similar to Iroquois are Spanish (1.9%, a difference of 0.35%), Immigrants from Bulgaria (1.9%, a difference of 0.40%), Immigrants from Croatia (1.9%, a difference of 0.47%), Cree (1.9%, a difference of 0.50%), and Immigrants from Serbia (1.9%, a difference of 0.58%).
| Demographics | Rating | Rank | No Schooling Completed |
| Pueblo | 96.4 /100 | #112 | Exceptional 1.9% |
| Immigrants | Zimbabwe | 96.2 /100 | #113 | Exceptional 1.9% |
| Immigrants | Norway | 96.1 /100 | #114 | Exceptional 1.9% |
| Syrians | 96.0 /100 | #115 | Exceptional 1.9% |
| Lebanese | 96.0 /100 | #116 | Exceptional 1.9% |
| Immigrants | Serbia | 95.8 /100 | #117 | Exceptional 1.9% |
| Spanish | 95.5 /100 | #118 | Exceptional 1.9% |
| Iroquois | 95.1 /100 | #119 | Exceptional 1.9% |
| Immigrants | Bulgaria | 94.6 /100 | #120 | Exceptional 1.9% |
| Immigrants | Croatia | 94.5 /100 | #121 | Exceptional 1.9% |
| Cree | 94.5 /100 | #122 | Exceptional 1.9% |
| Immigrants | Kuwait | 93.9 /100 | #123 | Exceptional 1.9% |
| Cambodians | 93.8 /100 | #124 | Exceptional 1.9% |
| Immigrants | Europe | 93.7 /100 | #125 | Exceptional 1.9% |
| Immigrants | Romania | 92.6 /100 | #126 | Exceptional 1.9% |