Belgian vs Danish Bachelor's Degree
COMPARE
Belgian
Danish
Bachelor's Degree
Bachelor's Degree Comparison
Belgians
Danes
37.0%
BACHELOR'S DEGREE
29.9/ 100
METRIC RATING
194th/ 347
METRIC RANK
38.1%
BACHELOR'S DEGREE
56.2/ 100
METRIC RATING
168th/ 347
METRIC RANK
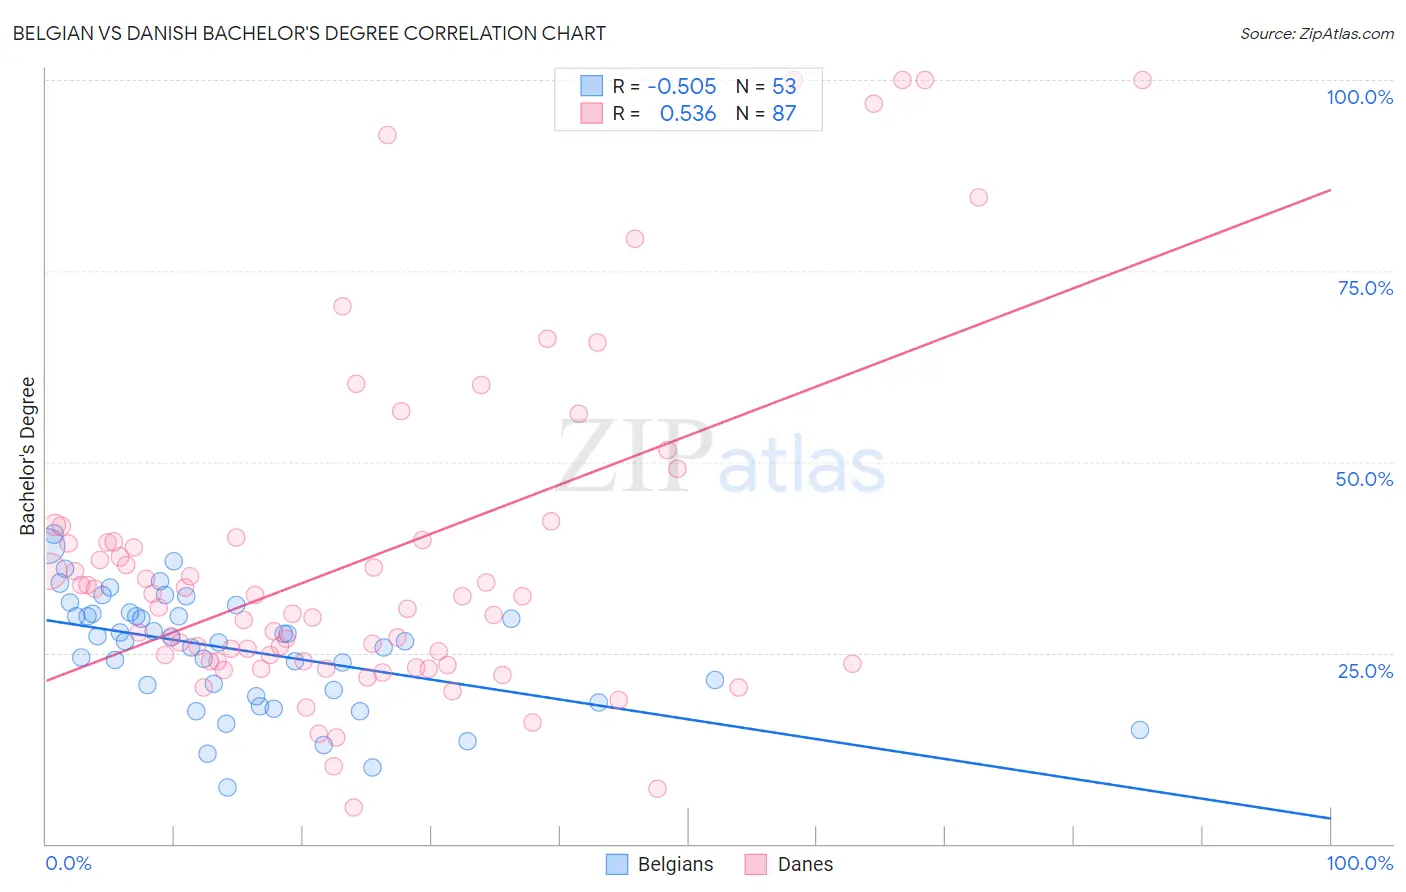
Belgian vs Danish Bachelor's Degree Correlation Chart
The statistical analysis conducted on geographies consisting of 356,003,324 people shows a substantial negative correlation between the proportion of Belgians and percentage of population with at least bachelor's degree education in the United States with a correlation coefficient (R) of -0.505 and weighted average of 37.0%. Similarly, the statistical analysis conducted on geographies consisting of 474,149,841 people shows a substantial positive correlation between the proportion of Danes and percentage of population with at least bachelor's degree education in the United States with a correlation coefficient (R) of 0.536 and weighted average of 38.1%, a difference of 2.7%.
Bachelor's Degree Correlation Summary
| Measurement | Belgian | Danish |
| Minimum | 7.4% | 4.8% |
| Maximum | 40.5% | 100.0% |
| Range | 33.1% | 95.2% |
| Mean | 25.4% | 37.4% |
| Median | 26.4% | 31.0% |
| Interquartile 25% (IQ1) | 19.7% | 23.9% |
| Interquartile 75% (IQ3) | 30.2% | 39.8% |
| Interquartile Range (IQR) | 10.5% | 15.9% |
| Standard Deviation (Sample) | 7.5% | 22.1% |
| Standard Deviation (Population) | 7.5% | 22.0% |
Similar Demographics by Bachelor's Degree
Demographics Similar to Belgians by Bachelor's Degree
In terms of bachelor's degree, the demographic groups most similar to Belgians are Korean (37.0%, a difference of 0.010%), Celtic (37.0%, a difference of 0.040%), Czechoslovakian (37.0%, a difference of 0.090%), Welsh (37.0%, a difference of 0.10%), and Yugoslavian (37.1%, a difference of 0.19%).
| Demographics | Rating | Rank | Bachelor's Degree |
| English | 39.7 /100 | #187 | Fair 37.4% |
| Immigrants | Oceania | 37.3 /100 | #188 | Fair 37.3% |
| Slovaks | 36.9 /100 | #189 | Fair 37.3% |
| Swiss | 34.1 /100 | #190 | Fair 37.2% |
| Nigerians | 33.9 /100 | #191 | Fair 37.2% |
| Immigrants | Vietnam | 32.1 /100 | #192 | Fair 37.1% |
| Yugoslavians | 31.5 /100 | #193 | Fair 37.1% |
| Belgians | 29.9 /100 | #194 | Fair 37.0% |
| Koreans | 29.8 /100 | #195 | Fair 37.0% |
| Celtics | 29.5 /100 | #196 | Fair 37.0% |
| Czechoslovakians | 29.2 /100 | #197 | Fair 37.0% |
| Welsh | 29.1 /100 | #198 | Fair 37.0% |
| Immigrants | Costa Rica | 27.4 /100 | #199 | Fair 36.9% |
| Immigrants | Ghana | 27.4 /100 | #200 | Fair 36.9% |
| Immigrants | South Eastern Asia | 25.4 /100 | #201 | Fair 36.8% |
Demographics Similar to Danes by Bachelor's Degree
In terms of bachelor's degree, the demographic groups most similar to Danes are Scottish (38.1%, a difference of 0.030%), Ghanaian (38.0%, a difference of 0.090%), Czech (38.0%, a difference of 0.18%), Bermudan (38.0%, a difference of 0.20%), and Somali (38.1%, a difference of 0.24%).
| Demographics | Rating | Rank | Bachelor's Degree |
| Uruguayans | 65.8 /100 | #161 | Good 38.4% |
| Colombians | 65.0 /100 | #162 | Good 38.4% |
| Peruvians | 63.4 /100 | #163 | Good 38.3% |
| Hungarians | 62.1 /100 | #164 | Good 38.3% |
| Sri Lankans | 59.1 /100 | #165 | Average 38.2% |
| Somalis | 58.6 /100 | #166 | Average 38.1% |
| Scottish | 56.6 /100 | #167 | Average 38.1% |
| Danes | 56.2 /100 | #168 | Average 38.1% |
| Ghanaians | 55.3 /100 | #169 | Average 38.0% |
| Czechs | 54.4 /100 | #170 | Average 38.0% |
| Bermudans | 54.2 /100 | #171 | Average 38.0% |
| Immigrants | Somalia | 52.8 /100 | #172 | Average 37.9% |
| Immigrants | Iraq | 52.5 /100 | #173 | Average 37.9% |
| Immigrants | Bangladesh | 50.0 /100 | #174 | Average 37.8% |
| Immigrants | Uruguay | 48.3 /100 | #175 | Average 37.8% |