Belgian vs Egyptian Householder Income Ages 25 - 44 years
COMPARE
Belgian
Egyptian
Householder Income Ages 25 - 44 years
Householder Income Ages 25 - 44 years Comparison
Belgians
Egyptians
$94,262
HOUSEHOLDER INCOME AGES 25 - 44 YEARS
45.8/ 100
METRIC RATING
177th/ 347
METRIC RANK
$105,282
HOUSEHOLDER INCOME AGES 25 - 44 YEARS
99.7/ 100
METRIC RATING
60th/ 347
METRIC RANK
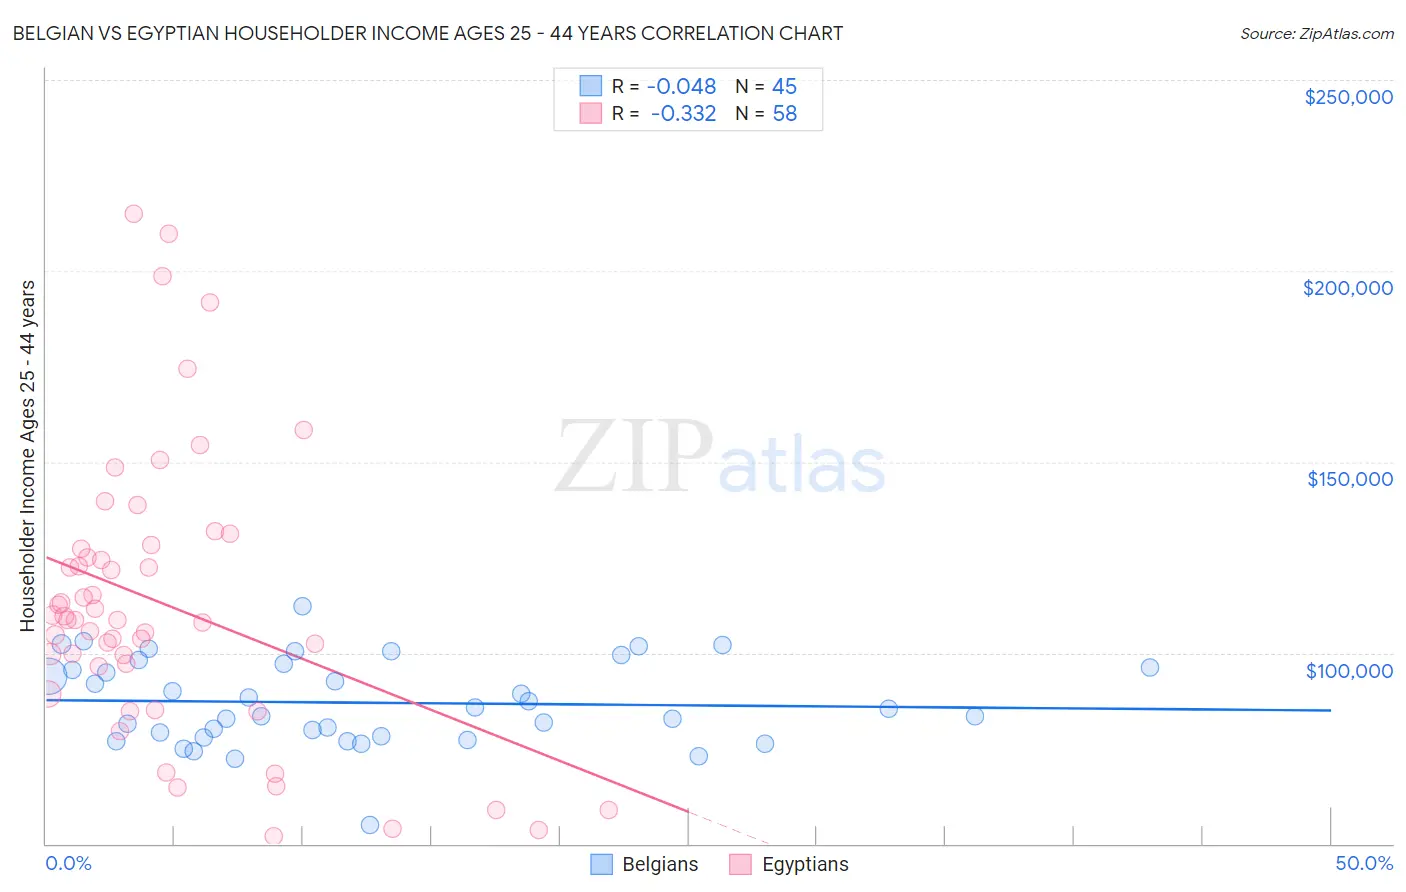
Belgian vs Egyptian Householder Income Ages 25 - 44 years Correlation Chart
The statistical analysis conducted on geographies consisting of 354,979,371 people shows no correlation between the proportion of Belgians and household income with householder between the ages 25 and 44 in the United States with a correlation coefficient (R) of -0.048 and weighted average of $94,262. Similarly, the statistical analysis conducted on geographies consisting of 276,427,528 people shows a mild negative correlation between the proportion of Egyptians and household income with householder between the ages 25 and 44 in the United States with a correlation coefficient (R) of -0.332 and weighted average of $105,282, a difference of 11.7%.
Householder Income Ages 25 - 44 years Correlation Summary
| Measurement | Belgian | Egyptian |
| Minimum | $55,000 | $52,083 |
| Maximum | $112,283 | $214,879 |
| Range | $57,283 | $162,796 |
| Mean | $86,931 | $112,843 |
| Median | $85,500 | $108,598 |
| Interquartile 25% (IQ1) | $78,009 | $96,583 |
| Interquartile 75% (IQ3) | $96,571 | $127,216 |
| Interquartile Range (IQR) | $18,562 | $30,633 |
| Standard Deviation (Sample) | $11,310 | $36,905 |
| Standard Deviation (Population) | $11,183 | $36,586 |
Similar Demographics by Householder Income Ages 25 - 44 years
Demographics Similar to Belgians by Householder Income Ages 25 - 44 years
In terms of householder income ages 25 - 44 years, the demographic groups most similar to Belgians are Immigrants ($94,423, a difference of 0.17%), English ($94,429, a difference of 0.18%), Immigrants from South America ($94,042, a difference of 0.23%), Colombian ($94,565, a difference of 0.32%), and Finnish ($94,610, a difference of 0.37%).
| Demographics | Rating | Rank | Householder Income Ages 25 - 44 years |
| Slovaks | 56.4 /100 | #170 | Average $95,032 |
| Immigrants | Armenia | 54.2 /100 | #171 | Average $94,867 |
| Scottish | 50.8 /100 | #172 | Average $94,622 |
| Finns | 50.6 /100 | #173 | Average $94,610 |
| Colombians | 50.0 /100 | #174 | Average $94,565 |
| English | 48.1 /100 | #175 | Average $94,429 |
| Immigrants | Immigrants | 48.0 /100 | #176 | Average $94,423 |
| Belgians | 45.8 /100 | #177 | Average $94,262 |
| Immigrants | South America | 42.8 /100 | #178 | Average $94,042 |
| French Canadians | 38.2 /100 | #179 | Fair $93,694 |
| French | 37.8 /100 | #180 | Fair $93,665 |
| Puget Sound Salish | 37.7 /100 | #181 | Fair $93,661 |
| Uruguayans | 37.3 /100 | #182 | Fair $93,631 |
| Guamanians/Chamorros | 36.5 /100 | #183 | Fair $93,569 |
| Germans | 36.0 /100 | #184 | Fair $93,531 |
Demographics Similar to Egyptians by Householder Income Ages 25 - 44 years
In terms of householder income ages 25 - 44 years, the demographic groups most similar to Egyptians are Lithuanian ($105,223, a difference of 0.060%), Immigrants from Italy ($105,201, a difference of 0.080%), Immigrants from Scotland ($105,089, a difference of 0.18%), New Zealander ($105,085, a difference of 0.19%), and Immigrants from Netherlands ($105,082, a difference of 0.19%).
| Demographics | Rating | Rank | Householder Income Ages 25 - 44 years |
| Immigrants | Norway | 99.9 /100 | #53 | Exceptional $106,629 |
| Paraguayans | 99.9 /100 | #54 | Exceptional $106,615 |
| Greeks | 99.9 /100 | #55 | Exceptional $106,457 |
| Immigrants | Pakistan | 99.8 /100 | #56 | Exceptional $106,129 |
| Immigrants | Austria | 99.8 /100 | #57 | Exceptional $106,103 |
| Immigrants | South Africa | 99.8 /100 | #58 | Exceptional $105,748 |
| Immigrants | Latvia | 99.8 /100 | #59 | Exceptional $105,522 |
| Egyptians | 99.7 /100 | #60 | Exceptional $105,282 |
| Lithuanians | 99.7 /100 | #61 | Exceptional $105,223 |
| Immigrants | Italy | 99.7 /100 | #62 | Exceptional $105,201 |
| Immigrants | Scotland | 99.7 /100 | #63 | Exceptional $105,089 |
| New Zealanders | 99.7 /100 | #64 | Exceptional $105,085 |
| Immigrants | Netherlands | 99.7 /100 | #65 | Exceptional $105,082 |
| Laotians | 99.7 /100 | #66 | Exceptional $104,993 |
| Immigrants | Romania | 99.6 /100 | #67 | Exceptional $104,713 |