Basque vs South African Professional Degree
COMPARE
Basque
South African
Professional Degree
Professional Degree Comparison
Basques
South Africans
4.6%
PROFESSIONAL DEGREE
81.8/ 100
METRIC RATING
141st/ 347
METRIC RANK
5.7%
PROFESSIONAL DEGREE
100.0/ 100
METRIC RATING
57th/ 347
METRIC RANK
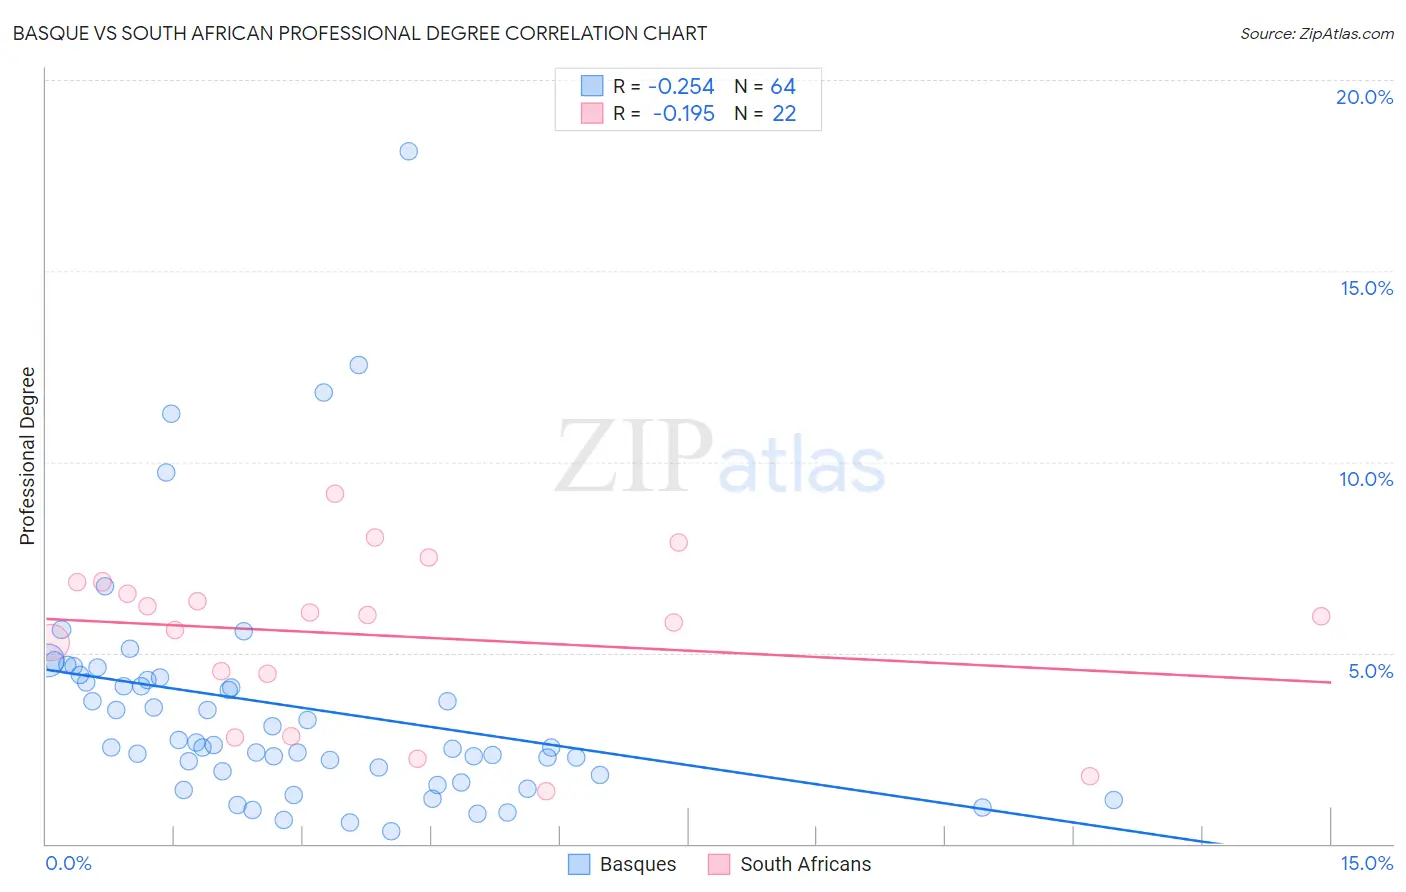
Basque vs South African Professional Degree Correlation Chart
The statistical analysis conducted on geographies consisting of 165,605,992 people shows a weak negative correlation between the proportion of Basques and percentage of population with at least professional degree education in the United States with a correlation coefficient (R) of -0.254 and weighted average of 4.6%. Similarly, the statistical analysis conducted on geographies consisting of 182,499,194 people shows a poor negative correlation between the proportion of South Africans and percentage of population with at least professional degree education in the United States with a correlation coefficient (R) of -0.195 and weighted average of 5.7%, a difference of 22.6%.
Professional Degree Correlation Summary
| Measurement | Basque | South African |
| Minimum | 0.33% | 1.4% |
| Maximum | 18.1% | 9.2% |
| Range | 17.8% | 7.8% |
| Mean | 3.6% | 5.5% |
| Median | 2.6% | 6.0% |
| Interquartile 25% (IQ1) | 1.9% | 4.5% |
| Interquartile 75% (IQ3) | 4.3% | 6.8% |
| Interquartile Range (IQR) | 2.5% | 2.4% |
| Standard Deviation (Sample) | 3.1% | 2.1% |
| Standard Deviation (Population) | 3.1% | 2.1% |
Similar Demographics by Professional Degree
Demographics Similar to Basques by Professional Degree
In terms of professional degree, the demographic groups most similar to Basques are Sudanese (4.6%, a difference of 0.13%), Hungarian (4.6%, a difference of 0.24%), Immigrants from South America (4.6%, a difference of 0.31%), Uruguayan (4.6%, a difference of 0.37%), and Canadian (4.7%, a difference of 0.62%).
| Demographics | Rating | Rank | Professional Degree |
| South American Indians | 89.9 /100 | #134 | Excellent 4.8% |
| Macedonians | 89.8 /100 | #135 | Excellent 4.8% |
| Immigrants | Jordan | 89.0 /100 | #136 | Excellent 4.7% |
| Jordanians | 88.9 /100 | #137 | Excellent 4.7% |
| Afghans | 88.8 /100 | #138 | Excellent 4.7% |
| South Americans | 85.6 /100 | #139 | Excellent 4.7% |
| Canadians | 84.4 /100 | #140 | Excellent 4.7% |
| Basques | 81.8 /100 | #141 | Excellent 4.6% |
| Sudanese | 81.3 /100 | #142 | Excellent 4.6% |
| Hungarians | 80.8 /100 | #143 | Excellent 4.6% |
| Immigrants | South America | 80.5 /100 | #144 | Excellent 4.6% |
| Uruguayans | 80.2 /100 | #145 | Excellent 4.6% |
| Luxembourgers | 78.7 /100 | #146 | Good 4.6% |
| Colombians | 77.7 /100 | #147 | Good 4.6% |
| Slovenes | 76.1 /100 | #148 | Good 4.6% |
Demographics Similar to South Africans by Professional Degree
In terms of professional degree, the demographic groups most similar to South Africans are Immigrants from Malaysia (5.7%, a difference of 0.26%), Immigrants from Western Europe (5.7%, a difference of 0.38%), Bulgarian (5.7%, a difference of 0.59%), Immigrants from Kuwait (5.7%, a difference of 0.79%), and Immigrants from Europe (5.6%, a difference of 1.1%).
| Demographics | Rating | Rank | Professional Degree |
| Immigrants | Czechoslovakia | 100.0 /100 | #50 | Exceptional 5.8% |
| Immigrants | Greece | 100.0 /100 | #51 | Exceptional 5.8% |
| Immigrants | Serbia | 100.0 /100 | #52 | Exceptional 5.8% |
| Immigrants | Netherlands | 100.0 /100 | #53 | Exceptional 5.8% |
| Immigrants | Kuwait | 100.0 /100 | #54 | Exceptional 5.7% |
| Immigrants | Western Europe | 100.0 /100 | #55 | Exceptional 5.7% |
| Immigrants | Malaysia | 100.0 /100 | #56 | Exceptional 5.7% |
| South Africans | 100.0 /100 | #57 | Exceptional 5.7% |
| Bulgarians | 100.0 /100 | #58 | Exceptional 5.7% |
| Immigrants | Europe | 100.0 /100 | #59 | Exceptional 5.6% |
| Bolivians | 99.9 /100 | #60 | Exceptional 5.6% |
| Immigrants | Lithuania | 99.9 /100 | #61 | Exceptional 5.6% |
| Immigrants | Belarus | 99.9 /100 | #62 | Exceptional 5.5% |
| Asians | 99.9 /100 | #63 | Exceptional 5.5% |
| Immigrants | Asia | 99.9 /100 | #64 | Exceptional 5.5% |